
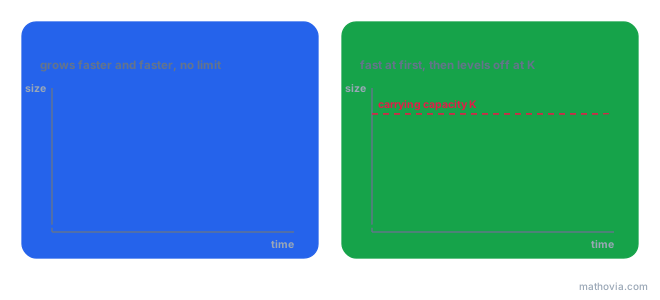
Drop a few bacteria into a dish of nutrients and, for a while, they double every twenty minutes like clockwork. If that kept up for two days, the colony would outweigh the Earth. It never does. The food runs low, waste builds up, and growth slows to a crawl. That story, explosive at first and then leveling off, is the difference between exponential vs logistic growth. The first model is simpler. The second is closer to what really happens.

Exponential vs Logistic Growth at a Glance
| Exponential growth | Logistic growth | |
|---|---|---|
| Shape of the graph | J-curve | S-curve (sigmoid) |
| Upper limit | none, grows without bound | the carrying capacity |
| Growth rate | keeps increasing | rises, peaks at |
| Resources assumed | unlimited | limited |
| Long-run behavior | ||
| Typical use | early growth, money, short time spans | populations, epidemics, adoption of new products |
The Two Formulas
| Symbol | Meaning |
|---|---|
| population (or amount) at time | |
| starting population, at | |
| growth rate constant (for example | |
| carrying capacity, the largest population the environment can support | |
| a constant set by the starting value: |
The exponential formula is the same one behind continuous compound interest,
What Is the Difference Between Exponential and Logistic Growth?
Both models agree on one thing: more individuals means more births. Where they part ways is what happens to the growth rate as the population fills up. Compare how fast each one grows at a given size
The extra factor
| Population as a share of | Room left, | Logistic rate compared with exponential |
|---|---|---|
| growth stops |
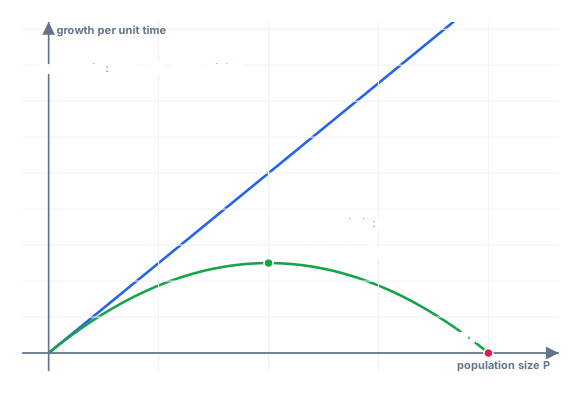
That picture explains everything else on this page. At small sizes the two lines start out together, so the curves look the same. The logistic rate peaks at
The Three Phases of Logistic Growth
Every logistic curve passes through the same three stages:
- Slow start (lag phase). The population is small, so even a high growth rate adds few individuals. The curve looks exponential.
- Rapid growth (log phase). Numbers climb steeply. Growth is fastest at the inflection point, where
. - Leveling off (stationary phase). Competition for food and space slows growth until the population hovers near
.
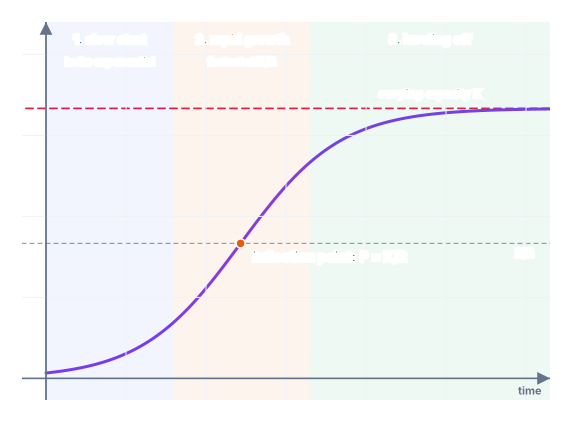
You can find when the inflection point happens. Set
This takes the same move as solving exponential equations: isolate the power of
Classify Each Description: Exponential or Logistic?
The question to ask is: is anything limiting the growth? If there is a ceiling, whether food, space, customers or people left to infect, the model is logistic. If nothing in the description limits growth, it is exponential.
| Description | Model | Why |
|---|---|---|
| A savings account earning a fixed | exponential | nothing caps the balance |
| Deer on an island with a fixed amount of grazing land | logistic | food and space set a ceiling |
| Bacteria in a lab dish during the first hour | exponential | resources are effectively unlimited for now |
| Bacteria in the same dish after two days | logistic | nutrients are running out |
| A rumor spreading through a school of | logistic | at most |
| A population whose growth rate stays constant as it gets bigger | exponential | constant per-capita rate means no brake |
| Sales of a new phone in a market that is becoming saturated | logistic | buyers run out |
| A population whose growth slows as it nears a maximum size | logistic | that maximum is the carrying capacity |
Real-World Examples
| Situation | Usual model | The carrying capacity |
|---|---|---|
| Yeast in a sealed container | logistic | sugar supply |
| Fish stocked in a lake | logistic | food and oxygen in the lake |
| Early days of an outbreak | exponential | none yet, most people are still uninfected |
| A whole epidemic, start to finish | logistic | the number of people who can catch it |
| Users of a new app | logistic | the number of people who could want it |
| Money at compound interest | exponential | none |
| Invasive species on a new continent | exponential, then logistic | habitat available |
Notice how often the answer is “exponential, then logistic”. That isn’t a contradiction. It is the slow-start phase of an S-curve, seen before the brake has kicked in.
Geometric vs Exponential Growth
The phrase “geometric growth” causes a lot of confusion, so here it is in one place. Geometric growth multiplies by the same factor in separate steps:
Worked Example
A lake is stocked with
Step 1 — find
Step 2 — write the model:
Step 3 — evaluate at
Step 4 — find when
Step 5 — find when
Step 6 — take the natural log:
The lake holds about
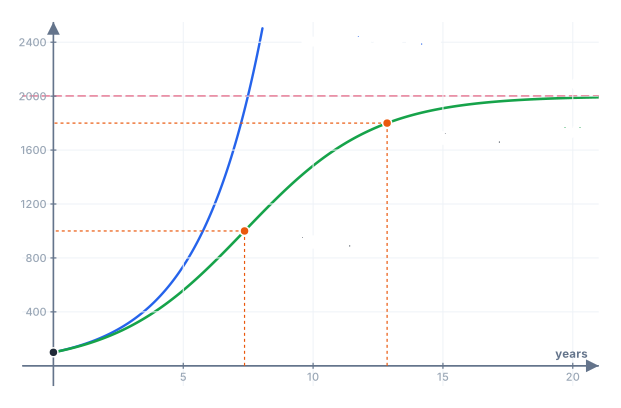
The blue curve shows why the choice of model matters. The exponential model
Common Mistakes to Avoid
- Assuming the two curves differ from the start. In the slow-start phase they are nearly identical. Early data alone often can’t tell you which model is right; you need to know whether a limit exists.
- Thinking logistic growth reaches
and stops. The curve approaches forever but never quite touches it, just as exponential decay never quite reaches zero. - Using
. The constant is a ratio: . With and it is , not . - Dropping the minus sign. The logistic exponent is
. With the denominator grows and the “population” collapses toward . - Placing the fastest growth at the end. Logistic growth is fastest in the middle, at
, not when the population is largest.
Practice Problems
Work each one before opening the answer.
Problem 1. Exponential or logistic? (a) Mold spreading across a single slice of bread. (b)
Show answer
Step 1 — look for a limit in each situation:
(a) The slice has a fixed area, so there is a ceiling. (b) Nothing caps the balance. (c) At most
Answer: (a) logistic, (b) exponential, (c) logistic
Problem 2. A population follows
Show answer
Step 1 — the numerator is the carrying capacity:
Step 2 — set
Step 3 — evaluate at
Answer:
Problem 3. A habitat can support
Show answer
Step 1 — find
Step 2 — write the model and evaluate at
Answer:
Problem 4. For the rabbits in Problem 3, when is the population growing fastest?
Show answer
Step 1 — fastest growth is at the inflection point,
Step 2 — evaluate:
Answer: after about
Problem 5. A rumor starts with
Show answer
Step 1 — the model, with
Step 2 — isolate the exponential:
Step 3 — take the natural log:
Answer: after about
Problem 6. For the fish in the worked example, compare the exponential model
Show answer
Step 1 — at
Step 2 — at
Answer: about
Problem 6 is the whole lesson in two lines. Exponential growth is a good short-term model and a poor long-term one whenever something limits the growth. For the full family of growth and decay models, including half-life and doubling time, see exponential growth and decay.