
Graphing a polynomial is the payoff for the rest of this chapter. End behavior settles what the two tails do, the zeros and their multiplicities settle where the curve meets the axis and how, and between them there is very little freedom left. No table of values required.

What a Sketch Actually Needs
Polynomial function graphs are continuous and smooth — no gaps, no corners, no asymptotes. That is a strong constraint: once you know the tails and the crossings, the curve has to join them up without jumping. It also means graphs of polynomials are fully described by a short list of features rather than by a long table of plotted points.
| Ingredient | Where it comes from | What it fixes |
|---|---|---|
| End behavior | degree and leading coefficient | both tails |
| Zeros | factored form | every |
| Multiplicity | exponent on each factor | cross or touch at each zero |
| vertical position and scale | ||
| Turning-point limit | at most | a check on the number of wiggles |
How to Graph Polynomials in Five Steps
| Step | What you do |
|---|---|
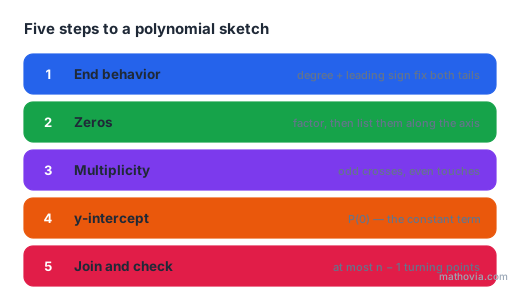
| 1 | Read the degree and leading coefficient; mark which way each tail goes |
| 2 | Factor and list the zeros in order along the axis |
| 3 | Label each zero’s multiplicity — odd crosses, even touches |
| 4 | Compute |
| 5 | Join the marks smoothly, respecting the tails, and check the turning-point count |
Between consecutive zeros the sign cannot change. A polynomial can only switch between positive and negative by passing through zero, so on each interval between zeros the curve stays entirely above or entirely below the axis. Once you know the sign on one interval, the multiplicities tell you every other.
Turning Points
A turning point is where the curve changes direction — a local peak or valley.
A polynomial of degree
has at most turning points.
A cubic can turn twice, a quartic three times. It can also turn fewer times:
Use the limit as a check, not a prediction. If your sketch of a cubic has three turns, the sketch is wrong — you cannot get there from a degree-
Worked Example: Graphing a Polynomial Function
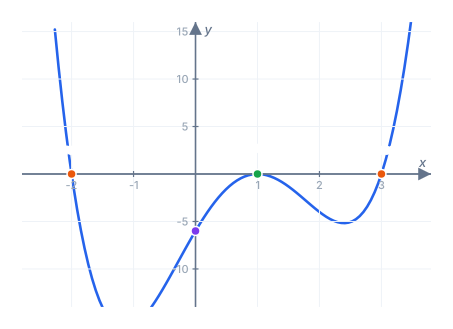
Sketch
Step 1 — end behavior. The degree is
Both tails rise.
Step 2 — zeros, read from the factors in order along the axis:
Step 3 — multiplicities. The exponents are
| Zero | Multiplicity | Behaviour |
|---|---|---|
| crosses | ||
| touches and turns | ||
| crosses |
Step 4 — the
So the curve passes through
Step 5 — assemble. Coming in from the left the curve is high, falls to cross at
Counting the turns in that description gives three, and the limit for degree
Write a Polynomial Function From a Graph
The process runs backwards just as well. Given a graph, you can recover a formula.
Suppose a curve crosses the
Step 1 — turn each zero into a factor, using the behaviour to set the exponent. Crossing at
Step 2 — use the known point to pin down
Step 3 — solve:
The leading coefficient
Common Mistakes to Avoid
- Ignoring multiplicity and crossing everywhere. A double zero touches. Drawing it as a crossing changes the sign of the whole next interval and wrecks the rest of the sketch.
- Letting the tails disagree with the degree. An even-degree polynomial cannot rise on one side and fall on the other, however the middle looks.
- Drawing more turns than
. Count them before you finish; extra wiggles are the most common sketching error. - Treating the
-intercept as optional. It is the only thing fixing vertical scale, and it is one substitution. - Forgetting
when reading a formula off a graph. and have identical zeros and completely different heights. - Expecting exact turning points. A sketch gets the shape right, not the peak heights — locating those exactly requires calculus.
Practice Problems
Work each before opening the answer.
Problem 1. Describe the end behavior and zeros of
Show answer
Step 1 — expanding gives leading term
Step 2 — zeros at
Step 3 —
Answer: an upward parabola crossing at
Problem 2. How many turning points can
Show answer
Step 1 — the degree is
Step 2 — the limit is
Answer: at most
Problem 3. Sketch the behaviour of
Show answer
Step 1 — degree is
Step 2 — odd degree with a negative lead means the left tail rises and the right tail falls.
Step 3 — zeros:
Step 4 —
Answer: comes down from the upper left, touches the axis at
Problem 4. A graph crosses the
Show answer
Step 1 — build the factors, with exponent
Step 2 — substitute the known point
Step 3 — solve for
Answer:
Problem 5. A student sketches a degree-
Show answer
Step 1 — the tails are fine. Even degree with a positive leading coefficient does send both ends up.
Step 2 — but a degree-
Answer: four turns is impossible for a quartic. The sketch has one wiggle too many — the tails are correct, the middle is not.
Problem 6. Without factoring, what is the
Show answer
Step 1 — the
Step 2 — notice the shortcut. The result is just the constant term.
Answer:
A sketch built this way gets every feature right except the exact height of the turning points, and those are a calculus problem rather than an algebra one. The same tail-and-zero reasoning transfers directly to rational functions, where the tails can level off at a horizontal asymptote instead of running away — the one behaviour a polynomial never has.