
Graphing turns a rule into something you can see. It is the fastest way to answer questions about a function that would otherwise take real algebra — where it is zero, how high it goes, whether it ever levels off.
What a Graph Actually Is
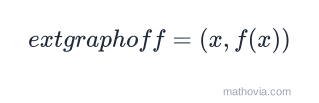
The graph of
So each point carries two facts: how far across (the input) and how far up (the output). Reading a graph is nothing more than reading those two numbers back off. See Function Notation for that skill in detail.
Because
The Table Method
This works for absolutely anything, and it is what to fall back on when the shape is unfamiliar.
- Choose inputs. Small integers around zero unless the function suggests otherwise.
- Evaluate the function at each.
- Plot the resulting points.
- Join them with a smooth curve, extending as far as the domain allows.
For
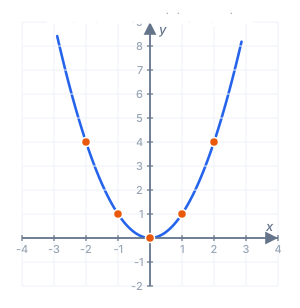
Choose inputs deliberately. If the function has a square root, start where the inside is zero. If it has a denominator, avoid the value that breaks it and take points either side. If it is a parabola, centre your inputs on the vertex rather than on zero — a table from
Join smoothly, not with straight segments, unless the function really is piecewise linear. And never join across a break in the domain.
Shapes Worth Knowing on Sight
Most functions you meet are one of a few basic shapes, moved around. Recognising the family lets you sketch from two or three points instead of eight.
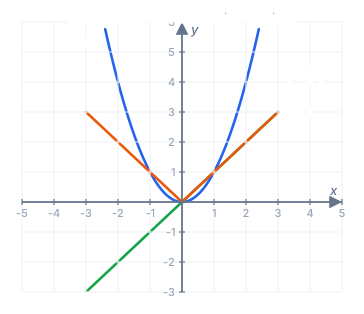
| Parent function | Shape | Domain | Range |
|---|---|---|---|
| straight line through the origin | all reals | all reals | |
| parabola, opening up | all reals | ||
| S-curve through the origin | all reals | all reals | |
| V with the point at the origin | all reals | ||
| half-parabola on its side | |||
| two branches, axes as asymptotes |
Every other member of a family is the parent shifted, stretched or reflected.
Features Worth Marking
A good sketch is not a hundred plotted points — it is a handful of correct ones, in the right places.
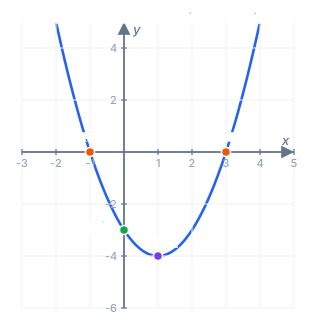
-intercept — evaluate . One substitution, always available unless 0 is outside the domain. -intercepts — solve . Also called the zeros or roots. See x- and y-Intercepts. - Turning points — the vertex of a parabola, or any peak or trough.
- Asymptotes — lines the curve approaches without touching, usually where the domain has a gap.
- Endpoints — where a restricted domain stops, drawn filled or open.
Mark those and the shape between them is nearly forced.
Increasing, Decreasing, and Turning
Read a graph left to right, the way you read text.
- Increasing where the curve rises as you move right.
- Decreasing where it falls.
- Constant where it is flat.
A turning point is where the behaviour switches.
These intervals are always stated in terms of
Graphing a Piecewise Function
A piecewise function uses different rules on different stretches of the domain. Graph each rule only where it applies. Piecewise Functions goes through evaluating, the domain and the boundary conventions in detail.
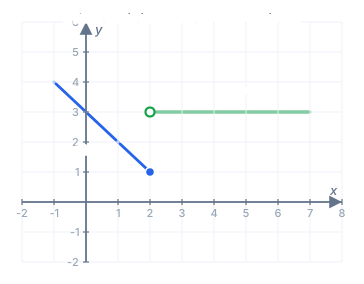
The boundary is where care is needed:
- Filled dot — that endpoint belongs to the graph (
or ). - Open circle — it does not (
or ). - Never join across the break. The pieces are separate.
Exactly one dot should be filled at any boundary value in the domain — two filled dots would mean two outputs for one input, breaking the function rule.
Using Domain and Range as a Check
Before you commit to a sketch, compare it against what you already know.
If you worked out the domain is
This works in both directions: the graph is also the most reliable way to find the range in the first place.
Worked Example A: A Line
Graph
The
Worked Example B: A Parabola
Graph
-intercept: . -intercepts: , so and . - Vertex: halfway between the roots at
, where .
Plot
Worked Example C: A Square Root
Graph
The domain starts where the inside is zero, at
| 1 | 2 | 5 | 10 | |
|---|---|---|---|---|
| 0 | 1 | 2 | 3 |
Perfect squares plus one make the arithmetic clean. The curve starts at
Worked Example D: An Absolute Value
Graph
The V has its point where the inside is zero, at
Worked Example E: A Reciprocal
Graph
Domain excludes 0, so there is a vertical asymptote there and a horizontal one at
Two separate branches. Do not join them across the asymptote.
Common Mistakes to Avoid
- Too few points on a curve. Two points only ever determine a line.
- Joining across a break. A gap in the domain means separate pieces.
- Plotting points as
. The input goes across. - Centring the table on zero regardless. Put the points where the action is.
- Straight segments between points. Most functions curve.
- Filling both dots at a piecewise boundary. That would give one input two outputs.
- Extending a restricted domain.
has nothing to the left of the origin. - Ignoring a negative sign in front.
opens downward.
Where Graphing Leads Next
- Transformations — shifting, stretching and reflecting a parent shape instead of tabulating.
- Solving equations graphically, by reading where two curves cross.
- Systems and inequalities, where solutions are regions rather than points.
- Domain and range, both easiest to read off a picture.
- Calculus, where the derivative formalises increasing, decreasing and turning points.
- Data and modelling, where a fitted curve is judged largely by eye.
Practice Problems
Work each one before opening the answer.
Problem 1. Give three points on the graph of
Show answer
Problem 2. What is the
Show answer
Problem 3. Find the
Show answer
Problem 4. Where is the vertex of
Show answer
Problem 5. Where does the graph of
Show answer
At
Problem 6. Where is the point of the V for
Show answer
At
Problem 7. Which parent function does
Show answer
The cubic
Problem 8. On what interval is
Show answer
Problem 9. Complete a table for
Show answer
Problem 10. For a piecewise function with
Show answer
The first piece is included, so there is a filled dot at
Problem 11. Why does the graph of
Show answer
The domain excludes
Problem 12. A graph runs from a filled dot at
Show answer
Domain
Quick Reference
| Step | What to do |
|---|---|
| 1. Domain | Find it first — it says how far to draw |
| 2. Recognise | Identify the parent shape if you can |
| 3. Intercepts | |
| 4. Turning point | Vertex or any peak/trough |
| 5. Table | Extra points around the interesting part |
| 6. Join | Smoothly, never across a domain break |
| 7. Check | Compare against the range |
| Piecewise | Graph each rule only on its own interval |
| Filled vs open dot | Included vs excluded endpoint |
Graphing rests on function notation for evaluating and on functions for the guarantee that the picture passes the vertical line test. Read the extent horizontally as the domain and vertically as the range; the general table technique is in Graphing Equations. More Algebra lessons are available.