Mathovia

Algebra / Graphing and Functions

Graphing Linear Inequalities

The graph of a linear inequality isn't a line but a whole region: every point on one side of a boundary line. Graphing one takes three decisions, the line, whether it's solid or dashed, and which side to shade, and each has a simple rule.

Practice Problems
Written by
MPhil in Mathematics, Founder of Mathovia
Published

Mathematics verification: Mathematical formulas, calculations, worked examples and solutions are reviewed for accuracy before publication. How we check our work

An equation like has a graph that’s a line: the points that make it exactly true. Change the equals sign to an inequality, , and the solutions are no longer a thin line but half of the whole plane. Graphing a linear inequality means drawing that half-plane. It’s the two-variable version of shading a number line, and it’s the first step toward systems of inequalities and linear programming.

A linear inequality: y greater than m x plus b, or y less than, greater than or equal to, or less than or equal to m x plus b
A linear inequality in slope-intercept form

How to Graph a Linear Inequality

  1. Draw the boundary line. Replace the inequality sign with and graph that line, using slope-intercept form or intercepts.
  2. Choose solid or dashed. Solid for and ; dashed for and .
  3. Pick a test point not on the line. is easiest unless the line passes through the origin.
  4. Shade. If the test point makes the inequality true, shade its side of the line. If it’s false, shade the other side.

Solid or Dashed, Above or Below

With on its own on the left, the symbol tells you everything at once:
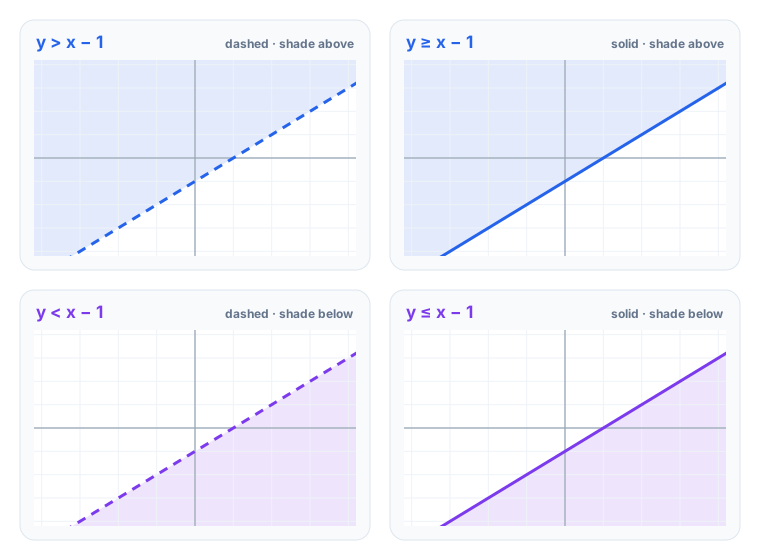
Four graphs of the line y = x − 1: y > x − 1 has a dashed line shaded above; y ≥ x − 1 has a solid line shaded above; y < x − 1 has a dashed line shaded below; y ≤ x − 1 has a solid line shaded below
The symbol decides the line style and the side
InequalityLineShade
dashedabove
solidabove
dashedbelow
solidbelow

The “above means greater” shortcut only works when is isolated on the left with a positive coefficient. Otherwise, use a test point, which always works.

Example 1: Slope-Intercept Form

Graph .

Step 1 — the boundary. has -intercept 1 and slope 2.

Step 2 — line style. The sign is , strict, so the line is dashed.

Step 3 — test . gives , which is false.

Step 4 — shade. The origin is below the line and isn’t a solution, so shade above the line. That matches the shortcut: means above.

Example 2: Standard Form

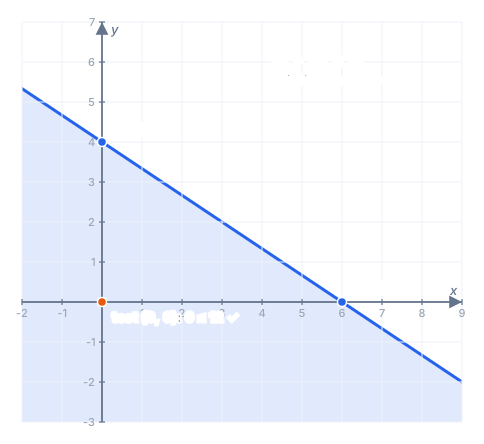
Graph .

The inequality 2x + 3y ≤ 12 graphed with a solid boundary line through the intercepts (0, 4) and (6, 0), the region below and left of it shaded, and the test point (0, 0) marked as true because 0 ≤ 12
Use the intercepts for the line and the origin as the test point

Step 1 — the boundary. For an equation in standard form, the intercepts are quickest. Setting gives ; setting gives . Draw the line through and .

Step 2 — line style. includes equality, so the line is solid.

Step 3 — test . gives , true.

Step 4 — shade the side containing the origin, below the line.

Example 3: When the Sign Flips

Graph .

Solving for means dividing by , which reverses the inequality:

Now it’s a dashed line with slope and intercept 3, shaded above. Forgetting the flip would shade the wrong half of the plane. A test point catches the mistake: gives in the original, false, so the origin must be unshaded. Since lies below , the shading goes above, as expected.

Horizontal and Vertical Boundaries

Inequalities with only one variable still have two-dimensional graphs in the coordinate plane.
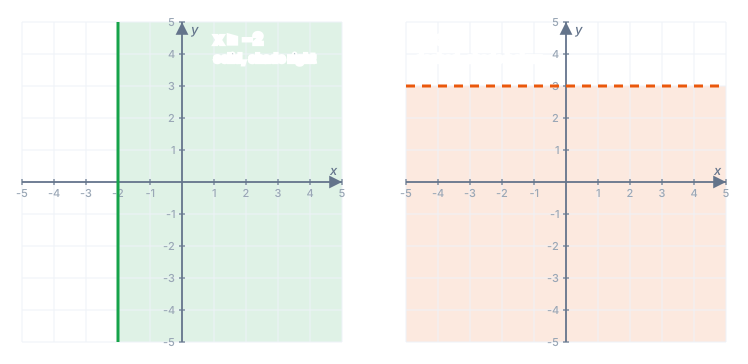
Two graphs: x ≥ −2 with a solid vertical line at x = −2 and everything to its right shaded; y < 3 with a dashed horizontal line at y = 3 and everything below it shaded
x-inequalities give vertical boundaries; y-inequalities give horizontal ones
  • : a solid vertical line at , shaded to the right, where is larger.
  • : a dashed horizontal line at , shaded below, where is smaller.

Writing an Inequality From a Graph

Work backwards through the same decisions. Find the equation of the boundary line, for example from its intercept and slope. A dashed line means or ; a solid line means or . Shading above means or . A dashed line shaded above gives . Check with any shaded point.

A Real-World Example

A school club sells snacks for and drinks for and needs at least . With snacks and drinks, the goal is

The boundary passes through and , solid because “at least” includes exactly. The origin fails the test ( is false), so shade above the line. Every shaded point with whole-number coordinates, such as 15 snacks and 10 drinks (), is a combination that meets the goal. Only the first quadrant makes sense here, since you can’t sell negative snacks.

Common Mistakes to Avoid

  • Using a solid line for or . Strict inequalities exclude the boundary.
  • Not flipping the sign when multiplying or dividing by a negative.
  • Testing a point on the line. It gives no information; pick one clearly to one side.
  • Shading by the shortcut when isn’t isolated. is shaded below , not above. Test a point.
  • Mixing up vertical and horizontal. is vertical; is horizontal.

Practice Problems

Work each one before opening the answer.

Problem 1. Is the boundary of solid or dashed, and which side is shaded?

Show answer

includes equality, and is isolated with .

Answer: solid, shaded below

Problem 2. Is a solution of ?

Show answer

gives , true.

Answer: yes

Problem 3. Is a solution of ?

Show answer

, and is false.

Answer: no

Problem 4. Rewrite in slope-intercept form and say which side to shade.

Show answer

Divide by and flip the sign: .

Answer: , dashed line, shaded below

Problem 5. What are the intercepts of the boundary of ?

Show answer

gives ; gives .

Answer: and

Problem 6. A graph has a dashed boundary with the region below it shaded. Write the inequality.

Show answer

Dashed means strict, below means less than.

Answer:

One inequality gives one half-plane. Put two or more together and the solutions are the overlap of their shaded regions, which is the subject of systems of inequalities.

Frequently Asked Questions

How do you graph a linear inequality?+

Graph the boundary line as if the inequality were an equation. Make it solid for or and dashed for or . Then test a point not on the line, usually : if it makes the inequality true, shade its side; if not, shade the other side.

When is the line solid and when is it dashed?+

Solid when the inequality includes equality ( or ), because points on the line are solutions. Dashed when it's strict ( or ), because points on the line don't satisfy it.

How do you know which side to shade?+

Use a test point. Substitute a point that isn't on the line, such as , into the original inequality. A true statement means shade the side containing that point. With alone on the left, there's a shortcut: or means shade above, or means shade below.

What does the shaded region represent?+

Every point in the shaded region is a solution of the inequality: its coordinates make the inequality true. Points in the unshaded region are not solutions, and points on a dashed boundary line aren't solutions either.

How do you graph an inequality like x > 3?+

The boundary is a vertical line, dashed because the inequality is strict. Shade the side where is bigger than 3, which is everything to the right of the line.

Related lessons