
Say you have
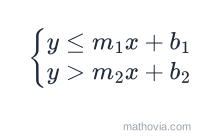
What Is a System of Inequalities?
A system of linear inequalities is two or more linear inequalities in the same variables, for example:
A solution is any point
Graphing One Inequality in Two Variables
Each inequality on its own shades half of the plane, called a half-plane. Two decisions turn the equation of a line into that picture: how to draw the line, and which side to shade.
| Inequality | Boundary line | Points on the line | Shade (when solved for |
|---|---|---|---|
| dashed | not solutions | below | |
| solid | solutions | below | |
| dashed | not solutions | above | |
| solid | solutions | above |
If the inequality isn’t solved for
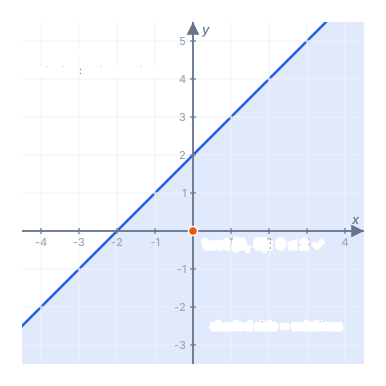
How to Solve a System of Inequalities by Graphing
- Graph the boundary line of the first inequality: solid for
or , dashed for or . - Shade the side that makes the first inequality true.
- Repeat for every other inequality, on the same axes and in a different color.
- Find the overlap. The region shaded by every inequality is the solution of the system.
- Check a point from the overlap in every inequality.
Example 1: Two Inequalities in Slope-Intercept Form
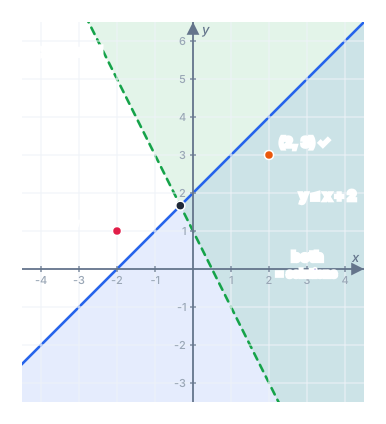
Sketch the solution to the system
Step 1 — first inequality: draw
Step 2 — second inequality: draw
Step 3 — the overlap is the wedge to the right of where the lines cross, which is at
Step 4 — check a point in the overlap, say
Which Point Is a Solution to the System of Inequalities?
You don’t need a graph to test a point. Substitute it into every inequality, and it’s a solution only if all of them are true.
| Point | Solution? | ||
|---|---|---|---|
| yes | |||
| no | |||
| yes, on the solid line | |||
| no, on the dashed line |
The last two rows show why the line style matters. A point on a solid boundary counts; a point on a dashed boundary doesn’t.
Example 2: A Closed Region
Graph the system
Step 1 —
Step 2 —
Step 3 —
Step 4 — the overlap is a triangle. Its corners, the vertices, are where the boundary lines meet:
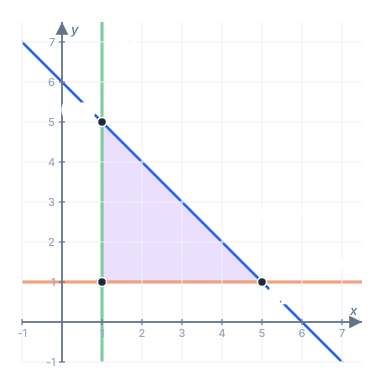
Bounded regions like this one are the starting point of linear programming, where you look for the corner that maximizes profit or minimizes cost.
Which System of Inequalities Is Shown by the Graph?
Many questions give you the shaded graph and ask for the system. Work one boundary at a time.
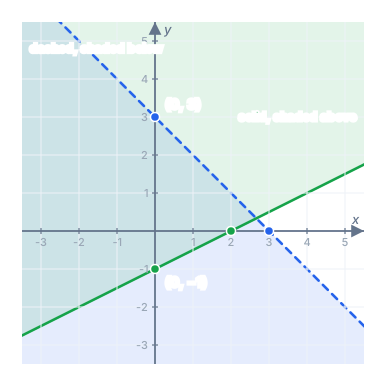
Step 1 — the blue line passes through
Step 2 — the green line passes through
Step 3 — the system:
Step 4 — confirm with a point in the overlap, such as
For multiple-choice versions (“which of the following systems of inequalities would produce the graph?”), testing one point from the overlap and one point outside it in each answer choice usually eliminates the wrong options fast.
When a System of Inequalities Has No Solution
Solve
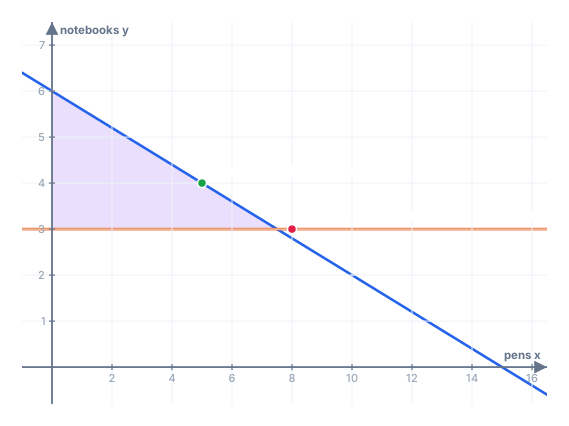
Worked Example: Staying Within a Budget
You have
Step 1 — variables:
Step 2 — one inequality per condition:
Step 3 — test 5 pens and 4 notebooks:
Step 4 — test 8 pens and 3 notebooks:
The first plan fits the budget exactly. The second costs
Common Mistakes to Avoid
- Using the wrong line style.
and need dashed lines; and need solid ones. - Shading by the symbol when the inequality isn’t solved for
. In , “less than” does not mean shade below. Solve for first (the sign flips: ) or use a test point. - Forgetting to flip the inequality when multiplying or dividing by a negative number.
- Using a test point on the boundary.
can’t be the test point when the line passes through the origin. Use or instead. - Reporting one point as “the” answer. The solution is the whole overlapping region, unless the question asks for something specific such as a vertex.
Practice Problems
Work each one before opening the answer.
Problem 1. Is
Show answer
Step 1 — check each inequality:
Answer: yes
Problem 2. Is
Show answer
Step 1 — check the first inequality:
Step 2 — one false inequality is enough to rule it out.
Answer: no
Problem 3. Describe how to graph
Show answer
Step 1 — the boundary is
Step 2 — the symbol is
Answer: a dashed line through
Problem 4. Which of the points
Show answer
Step 1 —
Step 2 —
Step 3 —
Answer:
Problem 5. A region lies above the dashed line
Show answer
Step 1 — dashed and above:
Step 2 — solid and below:
Answer:
Problem 6. Does the system
Show answer
Step 1 — both boundaries have slope
Step 2 — the first shades above the upper line, the second below the lower line. The regions never overlap.
Answer: no solution
Systems of inequalities describe what’s allowed; systems of equations pin down exactly what is. Real problems mix both, and turning a word problem into the right system is the skill that ties this whole chapter together.