
If you drive 120 miles in 2 hours, your average speed is 60 miles per hour, even though you probably sped up, slowed down and stopped at a light along the way. That single number, the change in distance divided by the change in time, is an average rate of change. The same idea works for any function: temperature over a day, a population over a decade, a price over a year. It’s the slope between two points, applied to any graph, not just straight lines.
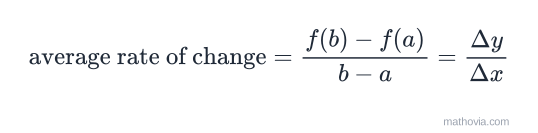
The Average Rate of Change Formula
For a function
| Symbol | Meaning |
|---|---|
| the start and end of the interval | |
| the outputs at those inputs | |
| the change in output, | |
| the change in input, |
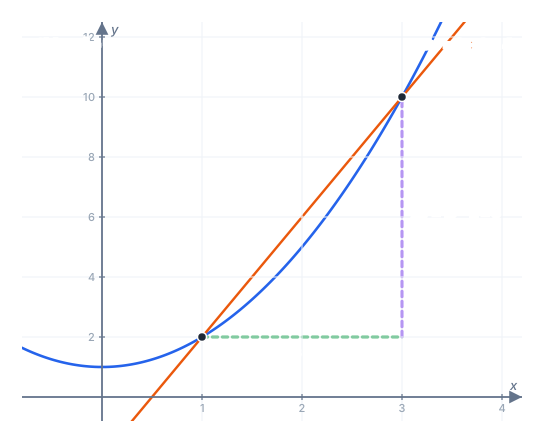
The units of the answer are always output units per input unit: miles per hour, dollars per year, degrees per minute. On a graph, the average rate of change is the slope of the secant line joining
How to Find the Average Rate of Change
- Identify the interval
. - Find the two outputs,
and , from the formula, table or graph. - Subtract the outputs and the inputs, in the same order.
- Divide the change in output by the change in input, and attach the units.
Example 1: From a Function
Find the average rate of change of
Step 1 — evaluate at both endpoints:
Step 2 — apply the formula:
On average,
Example 2: From a Table
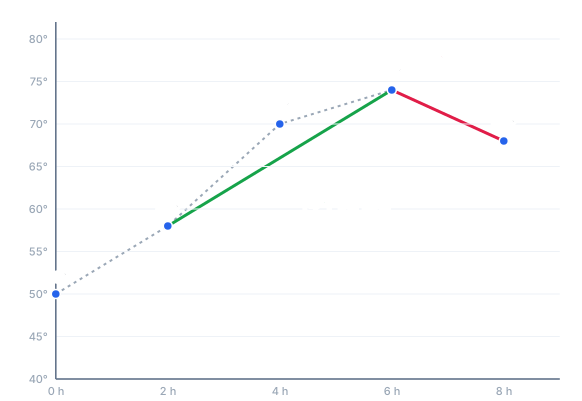
A thermometer was read every two hours:
| Time (hours) | 0 | 2 | 4 | 6 | 8 |
|---|---|---|---|---|---|
| Temperature (°F) | 50 | 58 | 70 | 74 | 68 |
Find the average rate of change from hour 2 to hour 6, and from hour 6 to hour 8.
Step 1 — hours 2 to 6:
Step 2 — hours 6 to 8:
The temperature rose
Example 3: A Real-World Rate
A car’s odometer shows it has gone
Average speed is the classic average rate of change: total distance changed divided by total time elapsed.
Is Average Rate of Change the Same as Slope?
For a straight line, yes. A line has the same slope everywhere, so every interval gives the same rate. For a curve, the answer depends on the interval. Here’s
| Interval | Calculation | Average rate |
|---|---|---|
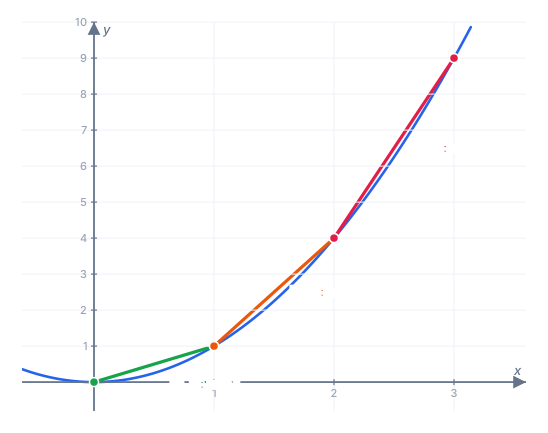
The rate keeps growing because the parabola gets steeper. That’s why an average rate of change always comes with its interval. “The average rate of change of
Positive, Negative and Zero Rates
| Average rate of change | Over the interval, the function… | Secant line |
|---|---|---|
| positive | ends higher than it started | rises |
| negative | ends lower than it started | falls |
| zero | ends at the same height it started | is horizontal |
A zero average rate doesn’t mean nothing happened. A ball thrown up and caught at the same height has an average rate of change of zero for its height, even though it went up and came back down. The average only compares the endpoints. To describe what happens in between, look at where the function is increasing and decreasing.
Average Rate of Change and the Difference Quotient
Replace the specific interval
That’s the difference quotient: the average rate of change written as a formula you can simplify once and then use for any interval. Shrinking
Common Mistakes to Avoid
- Subtracting in different orders. If the top is
, the bottom must be . Mixing them flips the sign. - Dividing by the outputs. It’s change in output over change in input, not the other way round.
- Using the middle values of a table. Only the two endpoint rows go into the formula.
- Forgetting the units. “4” is incomplete; “4 °F per hour” is the answer.
- Assuming the rate is the same on every interval. That’s only true for straight lines.
Practice Problems
Work each one before opening the answer. For any other function, interval or table, the average rate of change calculator shows the working and graphs the secant line.
Problem 1. Find the average rate of change of
Show answer
Step 1 — evaluate:
Step 2 — divide:
Answer:
Problem 2. Find the average rate of change of
Show answer
Step 1 — evaluate:
Step 2 — divide:
Answer:
Problem 3. Find the average rate of change of
Show answer
Step 1 — evaluate:
Step 2 — divide:
Answer:
Problem 4. Using the table, find the average rate of change on
| 1 | 3 | 5 | 7 | |
|---|---|---|---|---|
| 4 | 10 | 12 | 8 |
Show answer
Step 1 — read the endpoints:
Step 2 — divide:
Answer:
Problem 5. Find the average rate of change of
Show answer
Step 1 — evaluate:
Step 2 — divide:
Answer:
Problem 6. A town had
Show answer
Step 1 — change in population over change in years:
Answer:
Average rate of change compares only where a function starts and ends. To describe the whole journey in between, where it climbs, where it falls and where it levels off, you need increasing and decreasing intervals.