
Once you know what an exponential function is, its graph is the fastest way to understand how it behaves: where it starts, which way it heads, and the invisible line it can never cross. Graphing exponential functions comes down to one parent curve plus the same function transformations you already use on parabolas and absolute values — so a few features and four moves cover every case you will meet.
The Parent Graph
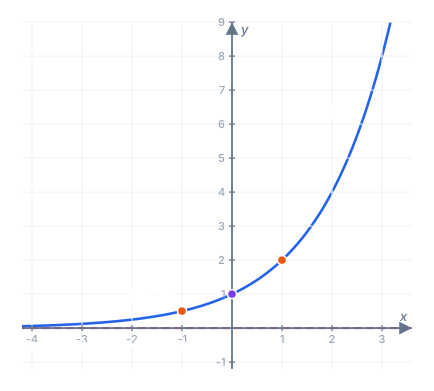
Start with
To the left the outputs halve toward zero; to the right they double without limit. Join the points with a smooth curve and you have the shape every exponential graph shares: flat and hugging the x-axis on one side, climbing steeply on the other.
Key Features of Exponential Functions
These characteristics of exponential functions hold for every parent graph
| Feature | Value for |
|---|---|
| Domain | |
| Range | |
| y-intercept | |
| x-intercept | none — the output is never |
| Horizontal asymptote | |
| Direction | increasing if |
| Also passes through |
The last row is a quick way to sketch any parent graph accurately: plot
Because every horizontal line above the x-axis meets the curve exactly once, an exponential function is one-to-one. That is what guarantees it has an inverse — the logarithm.
How the Base Changes the Graph
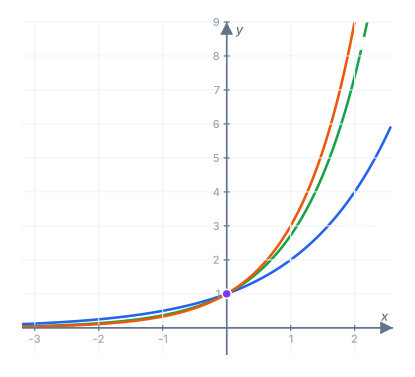
All parent graphs pass through
- A larger base (above
) makes a steeper climb to the right and a faster flattening to the left: is above for and below it for . - The natural base
sits between them. - A base between
and mirrors a growth curve across the y-axis. Since , the graph of is exactly reflected in the y-axis.
Transformations of Exponential Functions
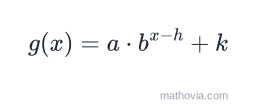
The general transformed exponential function is
Each parameter does one job:
| Change | Effect on the graph | Effect on key features |
|---|---|---|
| shift up | asymptote moves to | |
| shift right | asymptote unchanged | |
| vertical stretch | y-intercept scaled by | |
| reflect across the x-axis | range flips below the asymptote | |
| reflect across the y-axis | growth becomes decay |
The two moves that change the range are the vertical shift
Domain and Range of Exponential Functions
For
The domain never changes, because any real number can be an exponent. The range is always “everything on one side of the asymptote” — above it when
Example 1: Reading Key Features From the Equation
| Function | Transformations | Asymptote | Range | y-intercept |
|---|---|---|---|---|
| up | ||||
| right | ||||
| reflect in x-axis | ||||
| stretch | ||||
| reflect, up |
Note
Worked Example
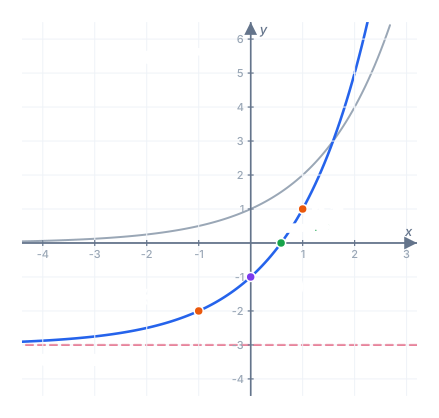
Graph
Step 1 — identify the parent and the transformations. Write the exponent as
The parent
Step 2 — move the asymptote with
Step 3 — find the y-intercept by setting
Step 4 — plot two more points to fix the shape:
Step 5 — locate the x-intercept. Set
Since
Step 6 — state domain and range.
Common Mistakes to Avoid
- Moving the asymptote with the horizontal shift. Only
moves a horizontal asymptote. still has asymptote . - Reading
as a shift right. Inside the exponent the sign is reversed: shifts the graph left . - Keeping the range as
after a shift. has range — the range starts at the asymptote, wherever it has moved. - Treating
as . The negative is outside the power, so is a reflection of , with range .
Practice Problems
Work each one before opening the answer.
Problem 1. Find the domain, range and horizontal asymptote of
Show answer
Step 1 — the domain of any exponential is all reals:
Step 2 —
Answer: domain
Problem 2. Describe the transformations that turn
Show answer
Step 1 — match to
Step 2 — translate the parameters into moves.
Answer: right
Problem 3. State the range and y-intercept of
Show answer
Step 1 — the negative sits outside the power, so this is
Step 2 — reflecting flips the range below the asymptote
Step 3 — evaluate at
Answer: range
Problem 4. For
Show answer
Step 1 — the vertical shift gives the asymptote:
Step 2 — evaluate at zero:
Step 3 — the base
Answer: asymptote
Problem 5. Write the function whose graph is
Show answer
Step 1 — reflect across the x-axis by negating the output:
Step 2 — shift up
Step 3 —
Answer:
Problem 6. Show that
Show answer
Step 1 — rewrite the fraction as a negative power:
Step 2 — the base
Answer: the same function; the graph falls from left to right
With the graph under control, the next question is the reverse: given a graph or a couple of points, what is the equation? The writing exponential functions lesson works backwards from exactly these features.