
Logarithmic functions appear whenever a quantity grows more and more slowly — loudness against sound energy, the pH of a solution against its acidity, the time to double an investment against its interest rate. Their graphs share one unmistakable shape, which is the exponential graph reflected across the line

Logarithmic Function Definition
A logarithmic function is a function of the form
It is the inverse of the exponential function
The Parent Graph
The easiest way to make a table for
As
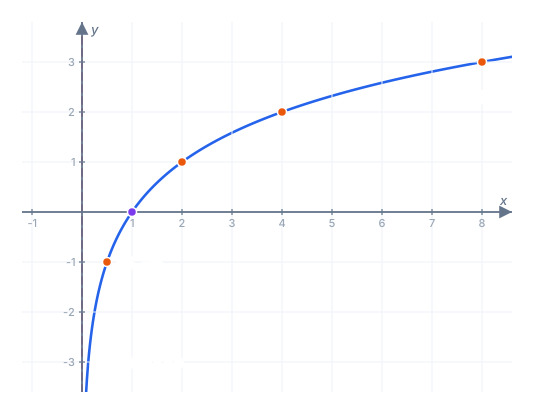
Key Features of Logarithmic Functions
| Feature | Value for |
|---|---|
| Domain | |
| Range | |
| x-intercept | |
| y-intercept | none — |
| Vertical asymptote | |
| Direction | increasing if |
| Also passes through |
Every row is the matching feature of
Graph of Exponential and Logarithmic Functions Together
| Domain | ||
| Range | ||
| Intercept | ||
| Asymptote | horizontal, | vertical, |
Plotted on the same axes, the two curves are mirror images across the line
The Natural Log Graph
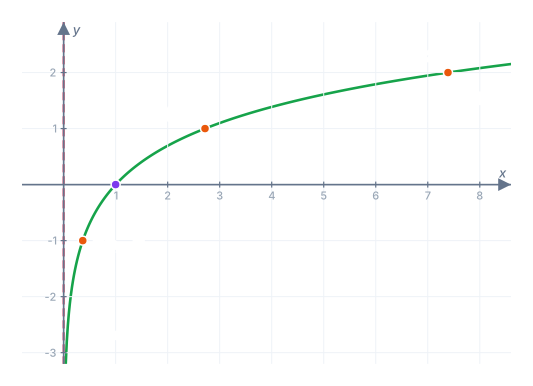
The graph of
How to graph the natural log: draw the dashed asymptote along the y-axis, plot
Transformations of Logarithmic Functions
The transformed logarithmic function is
| Change | Effect on the graph | Effect on key features |
|---|---|---|
| shift right | asymptote moves to | |
| shift up | asymptote unchanged | |
| reflect across the x-axis | increasing becomes decreasing | |
| vertical stretch | steeper climb | |
| reflect across the y-axis | domain becomes |
This is the mirror of the exponential case: for a logarithm, the horizontal shift moves the asymptote, and the vertical shift does not.
Finding the Domain of a Logarithmic Function
Set the argument greater than zero and solve:
| Function | Condition | Domain |
|---|---|---|
| all |
The boundary value from the condition is also the vertical asymptote.
Example 1: Key Features From the Equation
| Function | Asymptote | Domain | x-intercept |
|---|---|---|---|
For the second row,
Worked Example
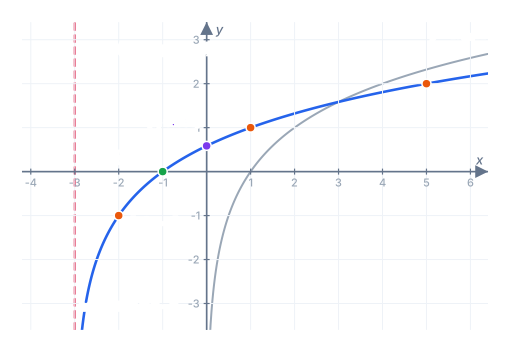
Graph
Step 1 — identify the shifts. Write
The parent
Step 2 — the horizontal shift moves the asymptote:
Step 3 — find the x-intercept by setting
Step 4 — find the y-intercept by setting
Step 5 — plot a few more points, choosing
The range is all real numbers, as for every logarithmic function.
Writing the Equation of a Transformed Logarithm
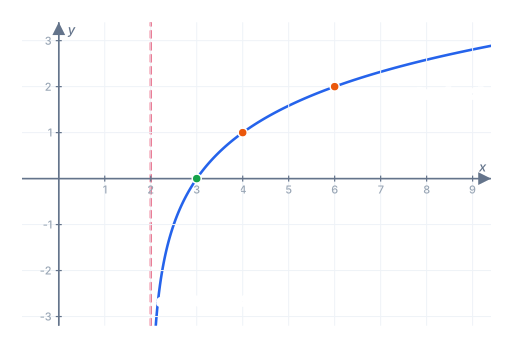
To write an equation for a transformed logarithm shown on a graph, read the asymptote first, then two points.
The graph below has asymptote
- The asymptote gives
, so the model is . - At
the argument is , and . Since there, . - At
the argument is and , so , meaning .
The equation is
Common Mistakes to Avoid
- Putting a y-intercept on the parent graph.
is undefined, so never touches the y-axis. - Moving the asymptote with
. For logarithms the asymptote is vertical, so only the horizontal shift moves it. - Reading
as a shift right. , a shift left by . - Drawing the curve levelling off. The log graph has no horizontal asymptote. It keeps rising, just slowly.
Practice Problems
Work each one before opening the answer.
Problem 1. Find the domain and vertical asymptote of
Show answer
Step 1 — the argument must be positive:
Step 2 — the boundary is the asymptote:
Answer: domain
Problem 2. Find the domain of
Show answer
Step 1 — set the argument positive:
Step 2 — add
Answer:
Problem 3. Find the asymptote and x-intercept of
Show answer
Step 1 — the argument is zero at the asymptote:
Step 2 — the x-intercept is where the argument equals
Answer: asymptote
Problem 4. Describe the transformations in
Show answer
Step 1 — the negative reflects across the x-axis;
Step 2 — set
Answer: reflected and shifted up
Problem 5. The graph of
Show answer
Step 1 — substitute the point:
Step 2 — convert to exponential form:
The base must be positive, so
Answer:
Problem 6. Give three points on
Show answer
Step 1 — use powers of
Step 2 — as
Answer:
Logarithmic and exponential functions are two views of the same relationship. The exponential vs logarithmic functions lesson puts them side by side and shows how to decide which one a problem calls for.