Mathovia

Algebra / Systems of Equations

Graphing Systems of Equations

Graphing turns a system of equations into a picture. Each equation becomes a line, and the solution is simply the point where the lines cross. It's the most visual way to solve a system, and it shows at a glance whether there's one solution, none, or infinitely many.

Practice Problems
Written by
MPhil in Mathematics, Founder of Mathovia
Published

Mathematics verification: Mathematical formulas, calculations, worked examples and solutions are reviewed for accuracy before publication. How we check our work

Two equations, two lines, one question: where do they meet? Solving a system of equations by graphing answers that question with a picture. You draw each equation as a line on the same grid, and the crossing point is the solution, because it’s the only point that lies on both lines. Graphing is rarely the fastest way to get an exact answer, but it’s the best way to see a system, and it’s often the method a test asks for by name.

Two lines y = m1 x + b1 and y = m2 x + b2 meet where m1 x + b1 = m2 x + b2
Graphing systems of equations

How to Solve a System of Equations by Graphing

  1. Put each equation in a graphable form. Slope-intercept form, , is the easiest. For standard form, , plotting the intercepts is quicker.
  2. Graph the first line. Plot the -intercept, then use the slope (rise over run) to plot a second point, and draw the line through them.
  3. Graph the second line on the same axes, the same way.
  4. Find the intersection. Read the coordinates of the point where the lines cross.
  5. Check the point in both original equations.

Behind the picture there’s a simple equation. Two lines and cross where their -values are equal:

The graph shows you where that happens; the algebra confirms it.

Example 1: Graphing From Slope-Intercept Form

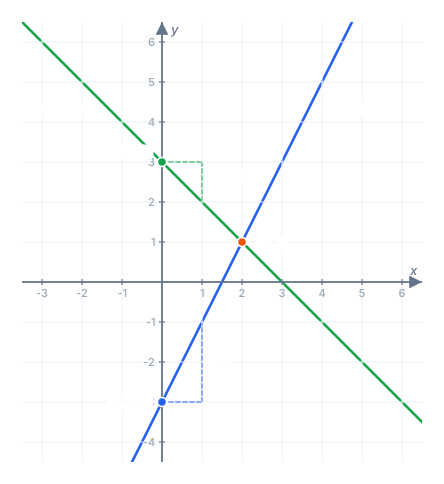
Solve by graphing: and .

Step 1 — graph : plot the intercept , then go up and right to . Draw the line.

Step 2 — graph : plot , then go down and right to . Draw the line.

Step 3 — read the intersection: the lines cross at .

Step 4 — check:

Answer:

The lines y = 2x − 3 and y = −x + 3, each drawn from its y-intercept with one slope step marked, crossing at (2, 1)
Start each line at its y-intercept, step out the slope, and read off where the lines cross

Example 2: Graphing From Standard Form

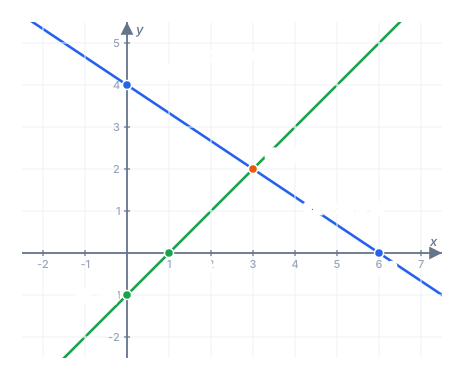
Solve by graphing: and .

Both equations are in standard form, so use their intercepts rather than rearranging.

Step 1 — intercepts of : setting gives ; setting gives . Plot and and join them.

Step 2 — intercepts of : gives ; gives . Plot and and join them.

Step 3 — read the intersection: .

Step 4 — check:

Answer:

The line 2x + 3y = 12 through its intercepts (6, 0) and (0, 4), and the line x − y = 1 through (1, 0) and (0, −1), crossing at (3, 2)
Two intercepts per line are all you need to draw it

Reading the Number of Solutions From a Graph

The graph also tells you what kind of answer to expect, before any algebra:

What you seeNumber of solutions
the lines cross at one pointexactly one
the lines are parallelnone
the lines lie on top of each otherinfinitely many

You can spot the last two before drawing anything: parallel lines share a slope but have different intercepts, and identical lines share both. The systems of linear equations lesson explains why these are the only three possibilities.

When Graphing Only Gives an Estimate

Graphing is exact only when the lines meet at a point you can read precisely. Solve and by graphing and the crossing lands between gridlines:
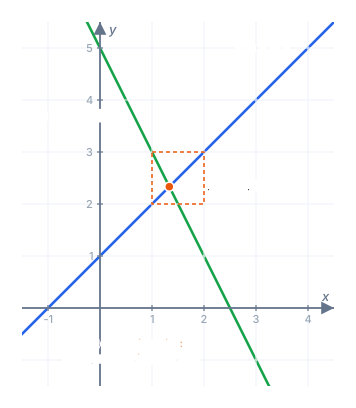
The lines y = x + 1 and y = −2x + 5 crossing at about (1.33, 2.33), inside a grid square rather than on a grid point
The crossing sits inside a grid square, so the graph can only estimate it

The best you can say from the picture is “about ”. To get the exact answer, set the two expressions equal:

This is the honest limit of the graphing method. Use it to see the solution and estimate it, then use the substitution method or the elimination method when you need exact values.

Choose the System of Equations That Matches a Graph

A common question runs the other way: given two graphed lines, which system do they represent? Read each line’s equation straight off the picture.
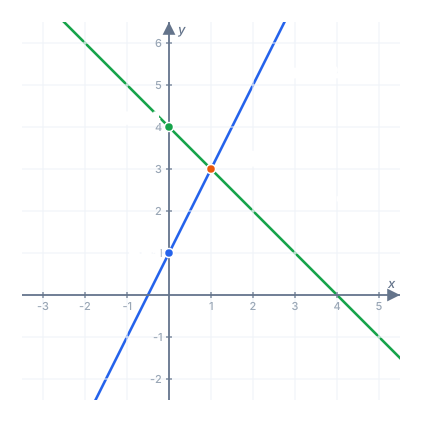
Two graphed lines: a blue line with y-intercept 1 and slope 2, and a green line with y-intercept 4 and slope −1, crossing at (1, 3)
Read the intercept and the slope of each line to rebuild the system

Step 1 — the blue line: it crosses the -axis at , and between and it rises for a run of . So .

Step 2 — the green line: it crosses at and falls for each step right. So .

Step 3 — the system and its solution:

Step 4 — confirm the intersection: ✓ and ✓.

In multiple-choice versions, the answer choices may be written in standard form. Rearrange each to , or simply test the intersection point in each choice. Only the correct system will be satisfied by it.

Graphing Systems With Technology

On a graphing calculator, enter each equation as and , graph them, and use the intersect feature. In an online graphing tool, type both equations and click the crossing point. Either way you get an accurate decimal answer quickly. When a question says “on a piece of paper, graph the system of equations”, though, it wants the hand-drawn method above: intercepts, slopes, and a clearly marked intersection.

Worked Example: Comparing Two Taxi Fares

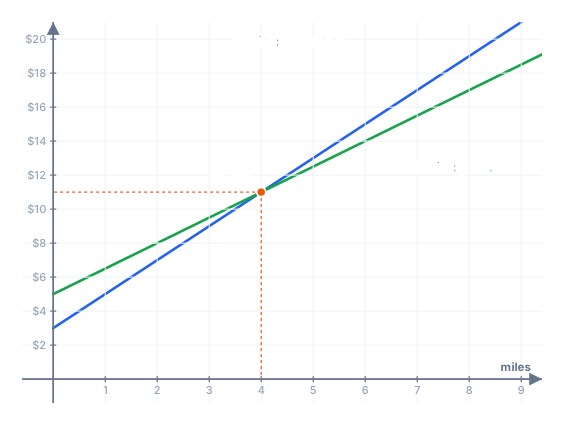
Taxi A charges plus per mile. Taxi B charges plus per mile. Graph both fares and find the distance at which they cost the same.

Step 1 — write the system, with in miles and in dollars:

Step 2 — graph Taxi A from with slope , and Taxi B from with slope .

Step 3 — read the intersection: the lines cross at .

Step 4 — check:

Both taxis charge for a 4-mile trip. For shorter trips Taxi A’s line is lower, so it’s cheaper; beyond miles Taxi B wins.

Taxi fare lines y = 2x + 3 and y = 1.5x + 5 crossing at (4, 11): Taxi A is cheaper before 4 miles and Taxi B after
The graph answers more than the question asked: it shows which taxi is cheaper on either side of 4 miles

Common Mistakes to Avoid

  • Using different scales on the two axes without noticing. Slopes look wrong and the crossing point gets misread. Label your scale.
  • Plotting the slope backwards. A slope of means down , right , not right , down .
  • Trusting an estimate as exact. If the crossing isn’t on a grid point, write “approximately” and confirm algebraically.
  • Skipping the check. A point read from a sketch is a guess until it satisfies both equations.
  • Drawing short line segments. Extend both lines across the grid; a crossing just off the end of a short segment is easy to miss.

Practice Problems

Graph each system (or picture it), then confirm your answer algebraically.

Problem 1. Solve by graphing: and .

Show answer

Step 1 — graph: the first line starts at with slope ; the second starts at with slope .

Step 2 — the lines cross at . Check:

Answer:

Problem 2. Solve by graphing: and .

Show answer

Step 1 — graph from intercepts and with slopes and .

Step 2 — the lines cross at . Check:

Answer:

Problem 3. Solve by graphing: and .

Show answer

Step 1 — intercepts: passes through and ; passes through and .

Step 2 — the lines cross at . Check:

Answer:

Problem 4. Solve by graphing: and .

Show answer

Step 1 — compare: both lines have slope , with different intercepts and .

Step 2 — the lines are parallel and never cross.

Answer: no solution

Problem 5. One line has -intercept and slope . The other passes through and . Write the system and find its solution.

Show answer

Step 1 — first line: .

Step 2 — second line: slope , intercept , so .

Step 3 — set them equal:

Answer: and , solution

Problem 6. Estimate the solution of and from a graph, then find it exactly.

Show answer

Step 1 — estimate: the lines cross a little to the right of , at a height between and , roughly .

Step 2 — solve exactly:

Answer: about ; exactly

Graphing makes systems visual, and that habit pays off. When one of the equations isn’t a straight line, the same picture-first approach is the clearest way to see how many solutions to expect.

Frequently Asked Questions

How do you solve a system of equations by graphing?+

Graph both equations on the same coordinate plane, usually by writing each in slope-intercept form and plotting the -intercept and slope. The point where the lines intersect is the solution. Substitute it into both equations to check.

What if the lines cross between grid points?+

Then graphing only gives an estimate. Read off the approximate coordinates, then confirm the exact answer with substitution or elimination. For and the graph suggests about ; the exact solution is .

What does a graph look like when a system has no solution?+

The two lines are parallel: they have the same slope but different -intercepts, so they never cross. If the two equations produce the very same line, every point on it is a solution and the system has infinitely many solutions.

How do you find the system of equations that matches a graph?+

For each line, read the -intercept where it crosses the -axis and count the slope as rise over run between two grid points. Write each line as . Then check that the marked intersection point satisfies both equations.

Is graphing an accurate way to solve a system?+

It's exact only when the lines cross at a point you can read precisely, usually a grid point. Otherwise it's an estimate. Its real strength is showing the shape of the problem: how many solutions there are and roughly where.

Related lessons