Mathovia

Math / Algebra

Average Rate of Change Calculator

Enter a function and an interval, or two rows from a table, and the calculator works out (f(b) − f(a)) / (b − a) step by step. It keeps answers exact, explains what the number means, and draws the secant line through the two points.

Use ^ for powers, / for fractions and sqrt( ) for roots; ln, log, exp, sin, cos and tan work too.

Average rate of change of f(x) = x² on [1, 4]

5

On average, the output rises 5 for every 1 unit increase in x.

123401020(1, 1)(4, 16)

f(x) secant line, slope 5

The average rate of change is the slope of the orange secant line joining the two points. Only the endpoints matter: what happens in between doesn't change the answer.

Secant line: y = 5(x − 1) + 1

  1. Find f(a) at a = 1f(1) = 1² = 1
  2. Find f(b) at b = 4f(4) = 4² = 16
  3. Subtract the outputs and the inputs in the same order[16 − 1] / [4 − 1] = 15 / 3
  4. Divideaverage rate of change = 5
Written by
MPhil in Mathematics, Founder of Mathovia
Published

Mathematics verification: Mathematical formulas, calculations, worked examples and solutions are reviewed for accuracy before publication. How we check our work

Average rate of change is one of those ideas you already use without the name. If a road trip covers 175 miles between hour 1 and hour 3, you’d happily say you averaged 60 mph, even though you sat at a red light and passed a truck at 75. That’s an average rate of change: how much one quantity moved per unit of another, measured only from the start and the end. This average rate of change calculator handles it for a formula, a pair of points or two rows of a table, and shows the working.
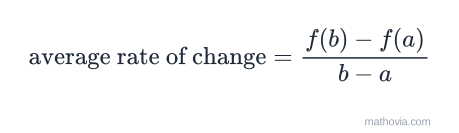
Average rate of change equals f of b minus f of a, divided by b minus a
The average rate of change of f on the interval from a to b

How to use the average rate of change calculator

  1. Choose a mode. “From a function” takes a formula and an interval. “From two points or a table” takes two pairs of numbers.
  2. Enter the function and the interval. Type powers with ^ and roots as sqrt( ). Fractions like 1/2 work in the interval boxes too, and so do ln, exp and the trig functions.
  3. Read the result. You get an exact value, a decimal if it’s a fraction, and a sentence saying what it means.
  4. Check the graph. The orange secant line joins the two points; its slope is your answer.

The average rate of change formula

Here and are the ends of the interval, and and are the outputs there. The top is the change in output and the bottom is the change in input, the same rise over run as the slope formula. The only new idea is that the two points sit on a curve rather than a line.

Worked example: f(x) = x² on [1, 4]

These are the calculator’s default inputs.

Step 1 — evaluate at the left end. .

Step 2 — evaluate at the right end. .

Step 3 — divide the changes.

On average, rises 5 units for each unit you move right between 1 and 4. It doesn’t rise at a steady 5, though. From 1 to 2 it climbs 3, and from 3 to 4 it climbs 7. The average smooths that out, which is exactly why it’s called an average.

An example with a fraction

For on :

The calculator keeps this as rather than rounding, which matters if a teacher wants an exact answer. The negative sign says the function fell over the interval.

Average rate of change from a table

Tables are where most people go wrong, usually by trying to use every row. You only need two: the rows at the ends of your interval.
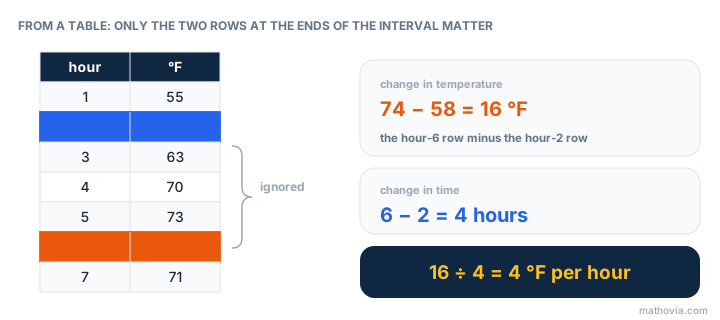
A table of temperatures by hour, with the hour-2 row (58 degrees) and the hour-6 row (74 degrees) highlighted and the rows between them marked ignored; the change in temperature is 74 − 58 = 16 degrees, the change in time is 6 − 2 = 4 hours, so the rate is 16 ÷ 4 = 4 degrees per hour
From hour 2 to hour 6, only those two rows count

Between hours 2 and 6 the temperature went from 58 °F to 74 °F:

In the calculator, switch to “From two points or a table” and type the two rows; this example is the default. The middle readings, 63, 70 and 73, don’t change the answer at all. Notice too that the temperature dropped after hour 6. Over the rate would be °F per hour, so the interval you choose matters as much as the data.

Reading the answer in context

The units of the answer are always output units per input unit, and saying them out loud is the quickest way to check it makes sense:

SituationDataAverage rate of change
A car trip55 mi at 1 h, 175 mi at 3 h60 miles per hour
A town’s population12,000 in 2015, 15,600 in 2021600 people per year
A ball thrown upward, 48 ft at 1 s, 48 ft at 3 s0 feet per second
A cooling cup of coffee180 °F at 0 min, 140 °F at 10 min−4 °F per minute

The ball is worth a second look. Its average rate of change from 1 to 3 seconds is zero, but it certainly moved: it went up to 64 feet and came back down to the same height. The average only compares the endpoints, so a zero can hide a lot of motion. The −16x^2 + 64x example in the calculator shows this one.

Average rate of change, slope and the derivative

On a straight line, the average rate of change is the same on every interval, and it’s just the slope from slope-intercept form. On a curve, each interval gives its own secant line and its own rate.

Now shrink the interval. Write the right endpoint as instead of and the formula becomes the difference quotient, . Let approach zero and the secant turns into the tangent line, and the average rate becomes the instantaneous rate: the derivative. The difference quotient calculator does that algebra symbolically if you want to see it happen. For the concept from the beginning, see the average rate of change lesson.

Common mistakes

  • Subtracting in different orders. If the top is , the bottom must be . Mixing them flips the sign.
  • Using the x-values as outputs. On you need and , not 1 and 4 themselves.
  • Averaging the outputs. is the average value of two outputs, a different thing entirely. Rate of change divides a difference by a difference.
  • Adding up every step in a table. Only the endpoints count; the middle rows cancel out anyway.
  • Forgetting units. “4” is incomplete. “4 degrees per hour” answers the question.

To check yourself on a mix of formulas, tables and word problems, try the average rate of change practice problems.

Frequently Asked Questions

How do you find the average rate of change of a function over an interval?+

Evaluate the function at both ends of the interval [a, b], subtract the outputs, and divide by the difference of the inputs: (f(b) − f(a)) / (b − a). For f(x) = x² on [1, 4] that's (16 − 1) / (4 − 1) = 5.

How do you find the average rate of change from a table?+

Pick the two rows at the ends of the interval and ignore everything in between. Subtract the output values, subtract the input values in the same order, and divide. If the temperature is 58° at hour 2 and 74° at hour 6, the rate is 16 ÷ 4 = 4 degrees per hour.

Is the average rate of change the same as slope?+

It's the slope of the secant line joining the two points on the graph. For a straight line it equals the line's slope on every interval. For a curve it depends on which interval you choose.

What does a negative average rate of change mean?+

The function finished lower than it started over that interval. It may have gone up in between, but on average it fell by that many units for every one unit increase in x.

What is the difference between average rate of change and instantaneous rate of change?+

The average rate uses two points a fixed distance apart. The instantaneous rate is what the average rate approaches as the two points move together, which is the slope of the tangent line, the derivative.

What units does the average rate of change have?+

Output units per input unit. Miles and hours give miles per hour, dollars and years give dollars per year, and degrees and hours give degrees per hour.

Learn and practice this topic

Related calculators