
Curve sketching is the process of drawing an accurate graph of a function from its formula, using calculus to find every feature that matters. Each tool from this chapter answers one question:
answers where the graph rises and falls, and where its peaks and valleys are. answers which way the graph bends, and where the bending switches. - Limits answer what happens at the edges: asymptotes and end behavior.
A graphing calculator gives you a picture. Curve sketching tells you why the picture looks the way it does, and guarantees you haven’t missed a feature off-screen.
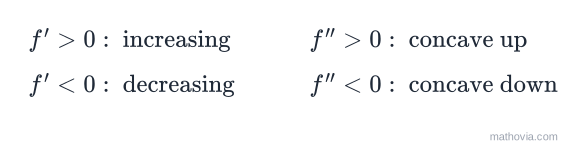
What f′ and f″ Tell You About a Graph
The sign of
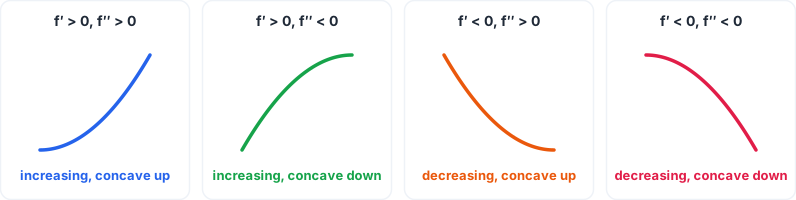
Curve sketching finds where those signs change, so you know which shape to draw on each interval.
Curve Sketching Steps
- Domain. Where is
defined? Note any excluded points. - Intercepts. The y-intercept is
. The x-intercepts solve (skip them if they’re hard to find). - Symmetry. If
, the graph is symmetric about the y-axis (even). If , it’s symmetric about the origin (odd). - Asymptotes and end behavior. Find vertical asymptotes with infinite limits and horizontal asymptotes with limits at infinity.
- First derivative. Find the critical points, make a sign chart for
, and list the intervals of increase and decrease and the local maxima and minima. - Second derivative. Make a sign chart for
, and list the intervals of concavity and the inflection points. - Sketch. Plot the intercepts, extrema and inflection points, draw the asymptotes, and connect the points with the shapes the sign charts call for.
Example 1: A Cubic
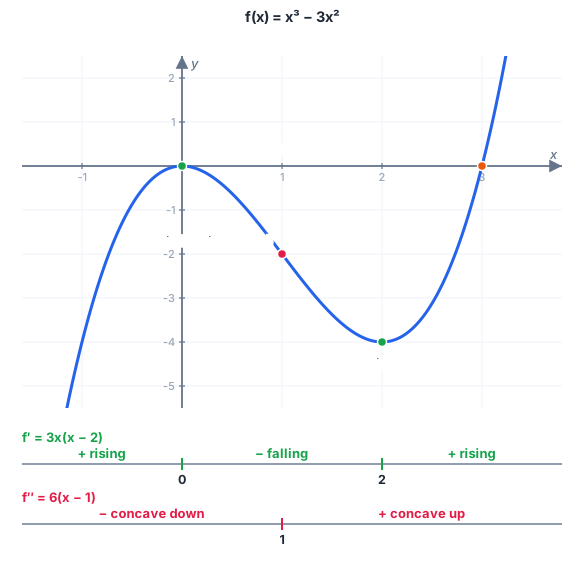
Sketch
Domain and intercepts. All real numbers.
Symmetry and asymptotes. Neither even nor odd. A polynomial has no asymptotes; as
First derivative.
| Interval | |||
|---|---|---|---|
| Sign of | + | − | + |
| increasing | decreasing | increasing |
So
Second derivative.
Sketch. Rise to the peak at
Example 2: A Quartic With a Flat Inflection Point
Sketch
Intercepts.
First derivative.
Second derivative.
Sketch. Come down from the upper left, concave up. At the origin the graph flattens out (horizontal tangent) and switches to concave down while still falling. At
Example 3: A Rational Function With Asymptotes
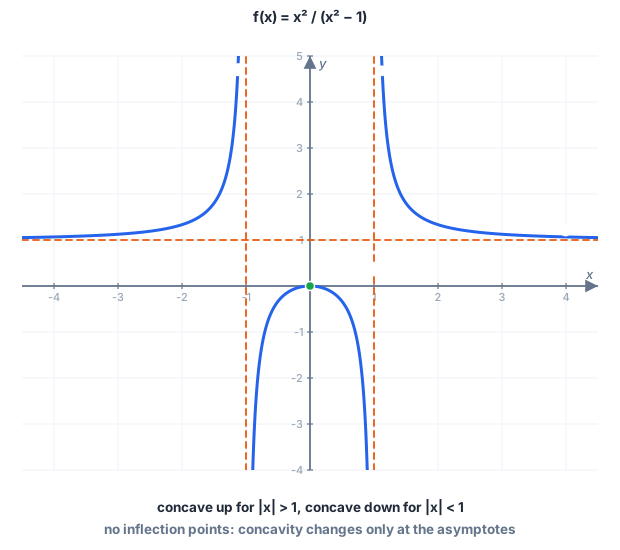
Sketch
Domain.
Intercepts and symmetry. The only intercept is
Asymptotes. The denominator is zero at
First derivative. By the quotient rule,
The denominator is positive, so
Second derivative. Differentiating again and simplifying,
The numerator is always positive, so the sign follows
Example 4: An Exponential Function
Sketch
Domain and intercepts. All real numbers; the only intercept is
End behavior. As
First derivative.
Second derivative.
Sketch. Rise steeply from the lower left through the origin, peak at
Graphs of f, f′ and f″
Curve sketching also runs in reverse: given the graph of a function, sketch its derivative graph, or given the graph of
| On the graph of | On the graph of | On the graph of |
|---|---|---|
| increasing | above the x-axis | |
| decreasing | below the x-axis | |
| local max or min | crosses the x-axis | |
| concave up | increasing | above the x-axis |
| concave down | decreasing | below the x-axis |
| inflection point | local max or min | crosses the x-axis |
Each graph tells you about the one above it in the same way: the sign of a graph is the direction of the graph above it.
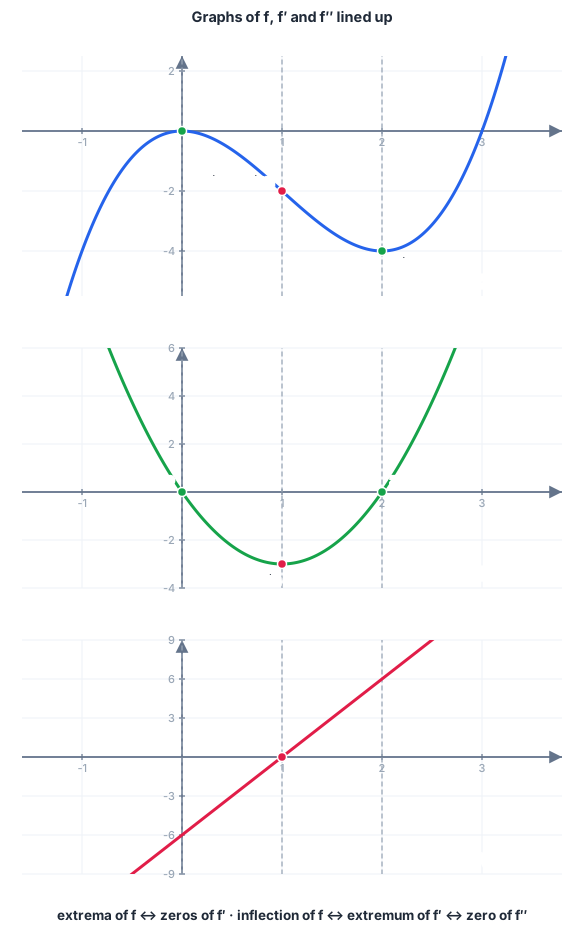
How to sketch the graph of f′ from the graph of f
- Find the horizontal tangents (peaks, valleys, flat spots) on
. Mark those x-values as zeros of . - Fill in the signs. Where
rises, draw above the x-axis. Where it falls, below. - Match the steepness. Where
is steepest, is farthest from the axis. Near a peak or valley, is close to zero. - Use the inflection points. Where
changes concavity, its slope is at a maximum or minimum, so has a peak or valley there.
You can also estimate individual values:
Reading f from the graph of f′
Going the other way, look at where the graph of
- Crosses from above to below:
has a local maximum there. - Crosses from below to above:
has a local minimum. - Touches the axis without crossing: horizontal tangent, but no extremum.
- Peak or valley of
: inflection point of .
The graph of
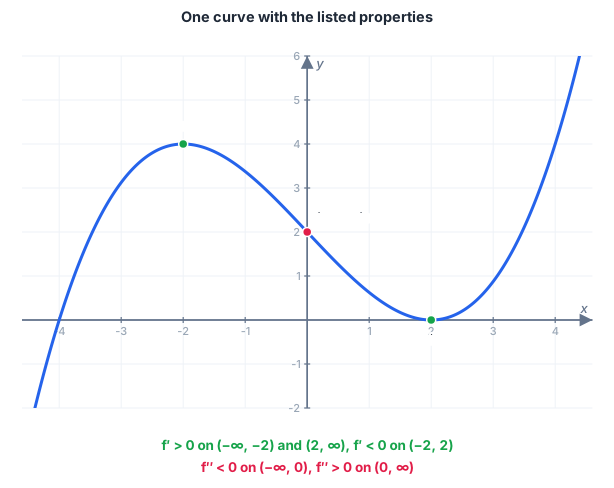
Sketch a Curve With the Following Properties
A common exercise gives you a list of properties instead of a formula.
Example 5. Sketch a curve with the following properties:
- Plot the given points
, and . - Read
. Rising, then falling at : local maximum at . Falling, then rising at : local minimum at . - Read
. Concave down to the left of 0 and concave up to the right: inflection point at . - Connect with an increasing-concave-down piece up to
, a decreasing-concave-down piece to , a decreasing-concave-up piece to , and an increasing-concave-up piece after.
The function
Common Mistakes
- Calling every critical point an extremum. Check that
changes sign. In Example 2, is a flat inflection point, not a minimum. - Calling every zero of
an inflection point. The sign of must change, and the point must be in the domain (Example 3 has none). - Connecting across a vertical asymptote. Treat each piece of the domain separately.
- Plotting only critical points. Intercepts and inflection points fix the shape between them.
- Mixing up the graph of
with the graph of . A peak on is a zero on , not a peak.
For more worked sketches, see Section 4.5 of the free textbook OpenStax Calculus Volume 1.
Practice Problems
Try each one before opening the answer. The practice set has 12 more with instant checking.
Problem 1. For
Show answer
Answer:
Problem 2. For
Show answer
Answer: local max
Problem 3. For
Show answer
Answer:
Problem 4. Find all asymptotes of
Show answer
The denominator is zero at
Answer: vertical
Problem 5. The graph of
Show answer
Answer:
Problem 6. The graph of
Show answer
Answer:
Curve sketching brings together every tool in this chapter. Next, the Integrals chapter starts with antiderivatives: undoing the derivative.