
The introduction to limits used tables of values to see what a function approaches. A graph does the same job at a glance. Learning how to find limits on a graph is mostly learning what to look at and what to ignore: the curve near
How to Find a Limit on a Graph
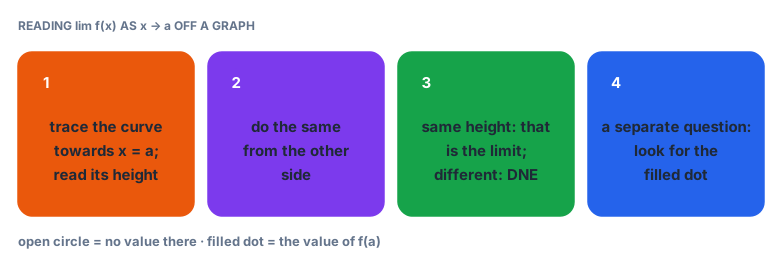
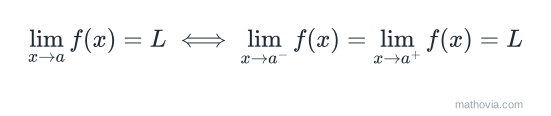
- Trace from the left. Follow the curve towards
from smaller values and note the height it heads for. That height is the left-hand limit, written . - Trace from the right. Do the same from larger
values. That gives the right-hand limit, . - Compare. If both heights are the same number
, then . If they differ, or the curve runs off to infinity, the limit does not exist. - Read
separately. It’s the height of the filled dot at . An open circle means no value there.
One Graph, Five Situations
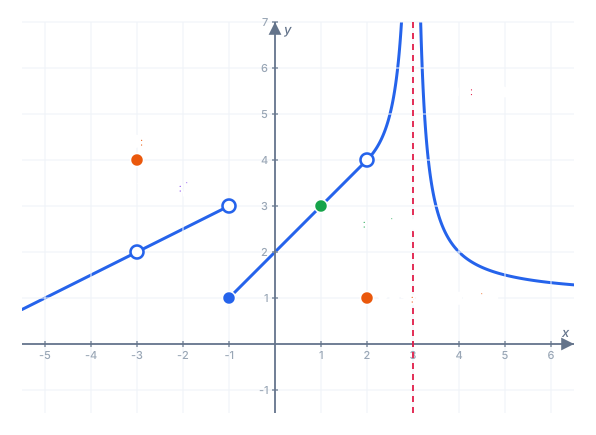
Every example below uses this one graph. It contains each feature you’re likely to meet: a hole, a jump, an ordinary point, a moved point and a vertical asymptote.
Example 1: An Ordinary Point (x = 1)
The curve passes smoothly through
This is the easy case: the limit and the value agree. Points like this are where the function is continuous.
Example 2: A Hole With a Separate Dot (x = −3)
Near
It’s tempting to answer 4 because that’s where the dot is. Resist it. The limit follows the curve, not the dot.
Example 3: A Jump (x = −1)
Here the two sides disagree.
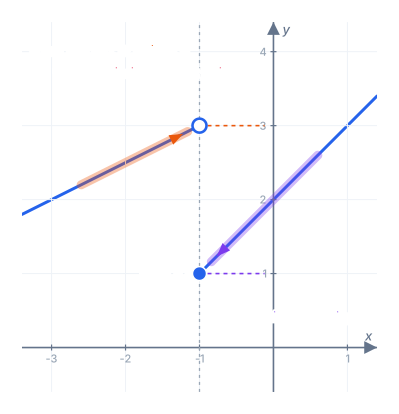
From the left the curve rises towards the open circle at height 3; from the right it comes down to the filled dot at height 1:
Since
Example 4: A Moved Point (x = 2)
The curve approaches the open circle at height 4 from both sides, but the function’s actual value has been placed lower, at height 1:
The limit exists and the value exists; they just aren’t equal. This is the situation the word “removable” describes in the lesson on types of discontinuity: move one point and the gap disappears.
Example 5: A Vertical Asymptote (x = 3)
Near the dashed line the curve shoots upwards on both sides, past every height you could name. No finite height is being approached, so
which means “grows without bound”, not “equals a number called infinity”. There’s also no dot at all, so
The Results Side by Side
| x = a | From the left | From the right | Limit | f(a) |
|---|---|---|---|---|
| −3 | 2 | 2 | 2 | 4 |
| −1 | 3 | 1 | does not exist | 1 |
| 1 | 3 | 3 | 3 | 3 |
| 2 | 4 | 4 | 4 | 1 |
| 3 | ∞ | ∞ | does not exist (∞) | undefined |
Notice that the last two columns are independent. The limit can exist without a value (a hole), the value can exist without a limit (a jump), and both can exist and still differ (a moved point).
Tips for Reading Graphs Accurately
- Look at the curve, not the dots. Open circles and filled dots tell you about
. The limit comes from the curve on either side. - Check both sides every time. A jump is easy to miss if you only trace from one direction.
- Be careful with scale. If the graph is drawn by hand or the gridlines are coarse, your reading is an estimate; algebra gives the exact value.
- Limits at ordinary points are easy. Where the curve is unbroken, the limit is just the height of the curve.
Common Mistakes to Avoid
- Answering with the filled dot’s height. At a hole or moved point, the limit and
are different numbers. - Saying the limit exists at a jump. If the sides disagree, it doesn’t, even if one of them has a filled dot.
- Calling
a limit value. Writing describes how the limit fails to exist.
Practice Problems
Use the graph from the examples above.
Problem 1. Find
Show answer
At
Answer: 2
Problem 2. Find
Show answer
The left-hand line passes through
Answer: 1
Problem 3. Find
Show answer
The filled dot is at height 4; the curve heads for the open circle at height 2.
Answer:
Problem 4. Find
Show answer
To the right of the asymptote the curve passes through
Answer: 2
Problem 5. Find
Show answer
From the left the curve approaches the open circle at 3; from the right it approaches the filled dot at 1.
Answer: 3 from the left, 1 from the right
Next, one-sided limits get their own lesson: what the