
The critical points of a function are the only places where it can have a local maximum or minimum, but not every critical point is one. The first derivative test sorts them out. It watches the sign of the derivative as you pass through each critical point: if the function switches from rising to falling, you’ve found a peak; from falling to rising, a valley; and if it keeps going the same way, neither. It’s the standard way to find local max and min values, and it also gives you the intervals where the function increases and decreases.

Increasing, Decreasing and the Sign of f′
The derivative is the slope of the tangent line, so its sign tells you which way the graph is heading:
- If
on an interval, is increasing there. - If
on an interval, is decreasing there.
This isn’t just a picture. It follows from the mean value theorem: for
The First Derivative Test
First derivative test. Let
be a critical point of a function that is continuous at .
- If
changes from positive to negative at , then has a local maximum at . - If
changes from negative to positive at , then has a local minimum at . - If
has the same sign on both sides of , then has no local extremum at .
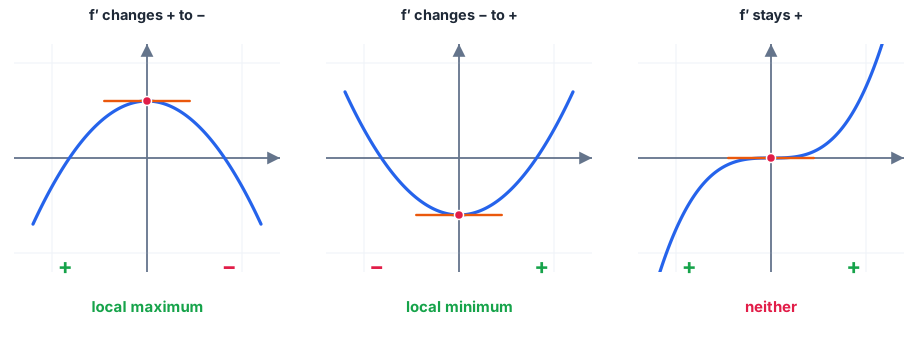
The reason is simple. If
How to Use the First Derivative Test
- Find
and factor it as far as you can. - Find the critical points: where
or is undefined, with in the domain of . - Make a sign chart. Mark the critical points (and any points outside the domain) on a number line. They split it into intervals.
- Test one point in each interval to find the sign of
there. - Read the chart. + to − is a local max, − to + is a local min, no change is neither. Evaluate
at each extremum to get the value.
The test points can be any numbers inside each interval. Pick easy ones.
Example 1: A Cubic
Find the local maximum and minimum of
Step 1 — derivative.
Step 2 — critical points.
Steps 3 and 4 — sign chart. Test
| Interval | Test point | ||
|---|---|---|---|
| increasing | |||
| decreasing | |||
| increasing |
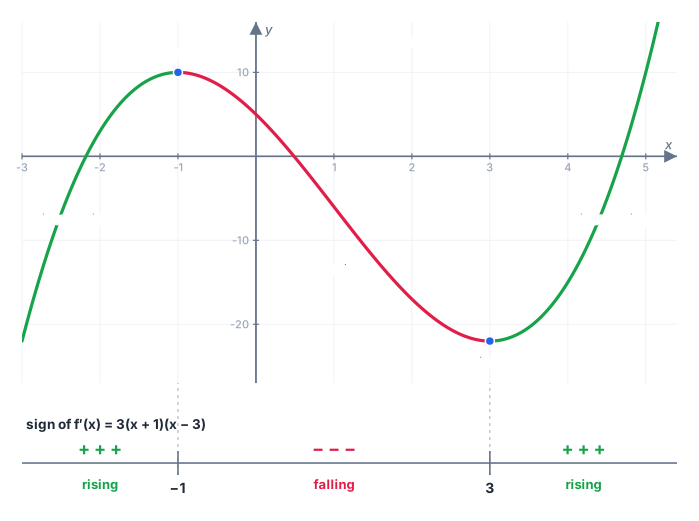
Step 5 — read the chart.
- At
, changes from + to −: local maximum . - At
, changes from − to +: local minimum .
Example 2: A Critical Point That Isn’t an Extremum
Classify the critical points of
The critical points are
| Interval | |||
|---|---|---|---|
| Sign of | − | − | + |
- At
the sign stays −, so there is no extremum. The graph flattens out for an instant and keeps falling. - At
the sign changes from − to +, so there’s a local minimum .
A squared factor like
Example 3: A Critical Point Where f′ Is Undefined
Find the local extrema of
| Interval | Test point | |
|---|---|---|
- At
, − to +: local minimum . The graph has a sharp cusp there, not a flat bottom. - At
, + to −: local maximum .
This is where the first derivative test beats the second derivative test:
Example 4: A Function With a Gap in Its Domain
Find the local extrema of
The critical points are
| Interval | ||||
|---|---|---|---|---|
| Sign of | + | − | − | + |
- At
: local maximum . - At
: local minimum .
The local maximum is smaller than the local minimum. That’s fine: “local” only compares a point with its neighbors, and the two branches of this graph are separated by the asymptote at
Example 5: A Trig Function
Find the local extrema of
- At
: local maximum . - At
: local minimum .
Example 6: Reading the Graph of f′
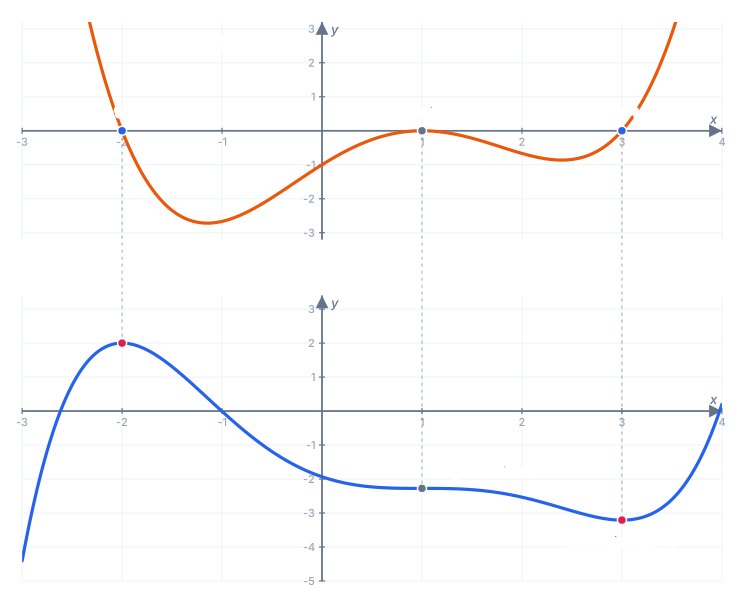
AP calculus questions often show the graph of
In the top graph,
- At
, the graph of crosses from above to below: + to −, so has a local maximum. - At
, it touches the axis and stays below: − to −, so neither. - At
, it crosses from below to above: − to +, so has a local minimum.
Don’t confuse the two graphs. The peaks and valleys of the graph of
Can Endpoints Be Local Extrema?
In most calculus textbooks, a local maximum at
Some courses define relative extrema so that endpoints can count. If your teacher or textbook does, a sign chart still tells you: if
First Derivative Test vs Second Derivative Test
| First derivative test | Second derivative test | |
|---|---|---|
| What you check | Sign of | Sign of |
| Local max | ||
| Local min | ||
| When it fails | never, if | when |
| Extra information | increasing and decreasing intervals | concavity at |
The second derivative test, covered next, is faster when
Common Mistakes
- Using the sign of
instead of . The chart is for the derivative. Whether is positive or negative doesn’t matter here. - Forgetting critical points where
is undefined, like in Example 3. - Leaving domain gaps off the sign chart. In Example 4,
could change sign at even though it isn’t a critical point. - Calling every critical point an extremum. In Example 2,
is neither. - Giving only the x-value. The local maximum value is
; the maximum occurs at .
Practice Problems
Try each one before opening the answer. The practice set has 12 more with instant checking.
Problem 1. Find the local extremum of
Show answer
Answer: local minimum
Problem 2. Find the local maximum and minimum of
Show answer
The sign of
Answer: local maximum
Problem 3. Does
Show answer
Answer: no local extrema
Problem 4. Find the local extremum of
Show answer
By the product rule,
Answer: local minimum
Problem 5. Classify the critical points of
Show answer
| Interval | ||||
|---|---|---|---|---|
| Sign of | + | − | − | + |
Answer: local maximum
Problem 6. Suppose
Show answer
Answer: a local minimum at
The first derivative test reads the sign of