
Body Mass Index is a ratio of weight to height that sorts adults into four bands — underweight, normal, overweight, obese. It was built in the 1830s as a way to describe populations, not to diagnose people, and that’s still the right way to read it: a fast, free screening number with well-known blind spots.
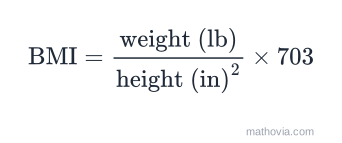
The BMI formula
US units:
Metric:
The 703 in the US version is the conversion factor that makes pounds-and-inches produce the same number as the metric formula.
Worked example
The calculator’s defaults are 160 lb and 67 inches (5 ft 7 in).
A BMI of 25.1 lands just over the line into the “overweight” band. That’s the kind of borderline result where the number’s limitations matter most — a few pounds of muscle versus fat make the same 25.1.
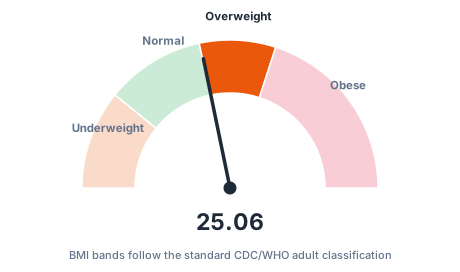
The BMI categories
| BMI | Category |
|---|---|
| Below 18.5 | Underweight |
| 18.5 – 24.9 | Normal weight |
| 25.0 – 29.9 | Overweight |
| 30.0 and above | Obese |
These cut-offs come from the CDC and WHO and apply to adults 20 and older. Children and teens use age- and sex-specific percentile charts instead.
What BMI misses
Body Mass Index is a simple ratio of weight to height, originally developed as a population-level statistical tool, not an individual diagnostic measure. It’s useful as a quick, free screening number, but it has real, well-documented blind spots.
Where BMI falls short
BMI can’t distinguish muscle from fat. A muscular athlete and a sedentary person of the same height and weight will show the identical BMI, despite very different body compositions and health profiles. It also doesn’t account for where fat is distributed on the body, which matters more for certain health risks than total body weight alone.
Why it’s still widely used
Despite its limits, BMI correlates reasonably well with health outcomes across large populations, and it costs nothing to calculate — just height and weight. That’s why it remains a standard first-pass screening tool in medical settings, usually followed up with more specific measurements if there’s a concern.
Using this calculator responsibly
Treat the category label as a starting point for a conversation with a doctor, not a verdict. If your result surprises you, or you have questions about what it means for you specifically, a healthcare provider can factor in muscle mass, family history, and other measurements a simple ratio can’t see.
Measurements that fill the gaps
- Waist circumference captures where fat sits — abdominal fat carries more metabolic risk than the same weight on the hips or legs.
- Waist-to-height ratio (waist ÷ height, ideally under 0.5) works across body types better than BMI alone.
- Body-fat percentage from calipers, a DEXA scan, or bioimpedance separates muscle from fat, which BMI cannot.
- Blood pressure, blood glucose, and lipid panels measure the health outcomes BMI is only a proxy for.
Common mistakes
- Entering height in feet instead of inches. 5 ft 7 in is 67 inches, not 5.7.
- Reading a borderline number as precise. A BMI of 24.9 and 25.1 are not meaningfully different.
- Applying adult cut-offs to a child or teen.
- Treating BMI as a body-fat measurement. It’s a weight-for-height ratio, nothing more.
Sources and assumptions
This calculator assumes:
- The categories are the standard adult ranges; they do not apply to children, teens or pregnancy.
- BMI does not distinguish muscle from fat, so very muscular people can read as overweight.
Sources:
- Adult BMI categories, Centers for Disease Control and Prevention
- Obesity and overweight fact sheet, World Health Organization
Figures last reviewed: . Educational estimates, not professional advice.