
BMI’s central flaw is that it cannot tell a pound of muscle from a pound of fat, which makes it useless for anyone who trains. FFMI fixes that by stripping the fat out first and asking a better question: how much lean mass do you carry for your height? It is the number strength athletes actually care about, and it comes with an interesting side effect — a fairly well-known ceiling on what is achievable without pharmaceutical help.
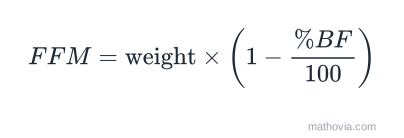
The FFMI formula
Two steps. First strip out the fat:
Then index it against height, exactly as BMI does:
The normalised version corrects for the fact that taller people score lower on the raw index for the same apparent build:
The 1.8 is the reference height in metres. A person exactly 1.8 m tall gets no adjustment; someone shorter gets a small deduction and someone taller a small addition.
Worked example
A man weighing 180 pounds at 70 inches tall with 17.5 percent body fat.
Step 1 — fat-free mass in pounds.
Step 2 — convert to kilograms.
Step 3 — height in metres, then squared.
Step 4 — the index.
Step 5 — normalise for height.
An FFMI of 21.4 is above average — someone who clearly lifts, without looking like it is their profession. For comparison his BMI is 25.8, which the standard chart calls “overweight”. That gap is the entire argument for using FFMI.
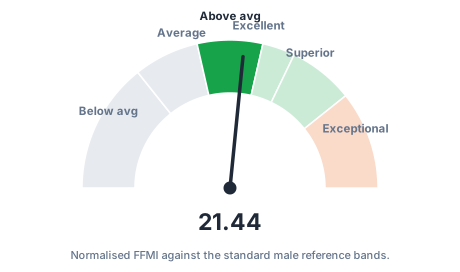
Reference bands
| FFMI (men) | FFMI (women) | Interpretation |
|---|---|---|
| under 18 | under 15 | Below average lean mass |
| 18–20 | 15–17 | Average, untrained |
| 20–22 | 17–19 | Above average, trains regularly |
| 22–23 | 19–20 | Excellent, visibly muscular |
| 23–25 | 20–21 | Superior, years of serious training |
| 25+ | 22+ | Beyond what is typical drug-free |
The women’s column runs about three points lower throughout. That is a difference in physiology, not effort — average lean mass relative to height simply differs between the sexes.
About the FFMI 25 ceiling
The number comes from a 1995 study that measured bodybuilders from before anabolic steroids were available and compared them with contemporary users. The drug-free group’s normalised FFMI clustered just below 25; almost nobody exceeded it.
It is worth being careful about what that means. It is a statistical observation about a sample, not a physical law. A handful of drug-free athletes with unusual frames do measure above 25, and the figure also inherits the error of whatever body fat measurement fed into it — a body fat reading three points too low will push FFMI up by roughly 0.7.
So an FFMI of 26 is genuinely unusual and worth a second look at your body fat number. It is not proof of anything.
FFMI against BMI
| BMI | FFMI | |
|---|---|---|
| What it measures | total weight for height | lean mass for height |
| Needs body fat % | no | yes |
| Muscular person | reads “overweight” | reads correctly |
| Sedentary person at normal weight | reads “normal” | reads low |
| Good for populations | yes | not routinely used |
| Good for lifters | no | yes |
The two disagree most in the cases that matter. A 200-pound athlete at 10 percent body fat and a 200-pound sedentary person at 30 percent share a BMI and have nothing else in common; their FFMIs differ by about six points.
Its one real weakness
FFMI is only as good as the body fat figure you feed it, and body fat is the hard part. A tape measurement carrying ±3 percentage points of error translates to roughly ±0.7 FFMI points — enough to move you a whole band.
Use the body fat calculator with the Navy tape method for a consistent input, and measure the same way every time. As with body fat itself, FFMI is far more useful as a trend than as a single figure. Gaining half a point over a training year is a real, measurable result; the absolute number carries more uncertainty than it appears to.
Common mistakes
- Using total weight instead of lean mass. That is just BMI with extra steps.
- Mixing units. The formula wants kilograms and metres. Convert first, or use the fields above which do it for you.
- Comparing raw and normalised figures. They differ by up to about a point at the extremes of height. Pick one.
- Using the male bands for women. Subtract about three points.
- Trusting an impedance scale’s body fat reading. Those swing several points with hydration alone, and every point of error moves FFMI by roughly 0.23.
- Treating 25 as a pass/fail line. It is a statistical pattern from one study, not a boundary.
If your height and weight are in metric, the inches to cm converter handles the conversion the other way; the calculator above expects pounds and inches.
Sources and assumptions
This calculator assumes:
- Body-fat percentage comes from your own measurement, so the result is only as accurate as that input.
- The normalised FFMI adjusts to a reference height of 1.8 m.
Sources:
Figures last reviewed: . Educational estimates, not professional advice.