
The wattage printed on a solar panel is measured in a lab, under 1,000 W/m² of light at 25°C, with the panel facing the source dead-on. Your roof is none of those things most of the time. Real production depends on how many panels you have, how much usable sunlight your location gets, and how much is lost between the cells and the meter. This calculator combines those into a practical estimate of daily, monthly, and yearly energy.
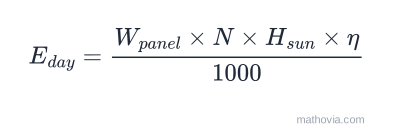
The solar output formula
Worked example
The calculator’s defaults are four 400 W panels, 5 peak sun hours, 85% system efficiency.
System capacity:
Daily energy:
Scaled out:
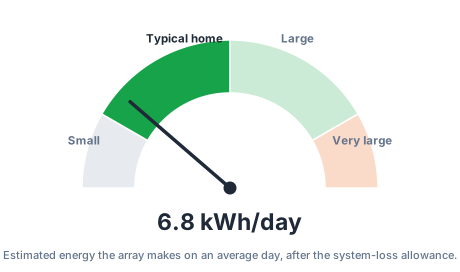
What a system this size can offset
| System | Daily (5 PSH) | Yearly | Rough share of a 900 kWh/mo home |
|---|---|---|---|
| 1.6 kW (4 × 400 W) | 6.8 kWh | ~2,480 kWh | ~23% |
| 4 kW (10 × 400 W) | 17.0 kWh | ~6,200 kWh | ~57% |
| 8 kW (20 × 400 W) | 34.0 kWh | ~12,400 kWh | ~115% |
| 12 kW (30 × 400 W) | 51.0 kWh | ~18,600 kWh | ~172% |
These assume the same 5 peak sun hours and 85% efficiency. A sunnier site or a better roof shifts every row up.
What your results mean
Total system capacity is the summed nameplate rating under standard test conditions — 1.6 kWp for four 400 W panels. You rarely see this number in practice; it’s the ceiling.
Daily output is the energy on an average day. Real days vary enormously: a clear day in June might beat it by 40%, an overcast December day might fall to a quarter of it.
Monthly and yearly output are the daily figure times 30 and 365. They smooth over seasonal swing, so treat them as an annual average rather than a promise for any given month.
What drags real production below the estimate
- Temperature. Panels lose about 0.3–0.5% of output per °C above 25°C, so a hot roof in July can run 10–15% down.
- Shading. Even partial shade on one panel can pull down a whole string, depending on the wiring and whether optimizers or microinverters are used.
- Orientation and tilt. South-facing at latitude tilt is the benchmark; east/west or a shallow pitch costs 10–25% a year.
- Soiling and snow. Dust, pollen, and bird droppings between rains; full cover under snow.
- Inverter clipping. If the array is oversized relative to the inverter, the brightest midday hours get capped.
Common mistakes
- Using daylight hours instead of peak sun hours. Peak sun hours is usually 3–7, not 10–14.
- Assuming 100% efficiency. Even a clean, well-designed system loses 10–20%.
- Applying one location’s sun hours everywhere. It’s the single most location-dependent input.
For a final system design, a site-specific assessment that models your exact roof, shading, and local weather data is the right tool; this calculator is for early sizing and comparing options.