
RPE turns “that felt heavy” into a number you can train with. If you know how many reps you had left in the tank, one hard set is enough to estimate your one-rep max, and from that, what to load for the next set. This calculator does both steps and rounds the answer to the plates on the bar.
What the RPE numbers mean
In strength training, RPE is rated by reps in reserve (RIR) — how many more good reps you could have done:
| RPE | Reps in reserve | What it feels like |
|---|---|---|
| 10 | 0 | Maximal. No more reps, no more weight. |
| 9.5 | 0–1 | No more reps, but a little more weight was possible. |
| 9 | 1 | One more rep was there. |
| 8.5 | 1–2 | Definitely one more, maybe two. |
| 8 | 2 | Two more reps. |
| 7 | 3 | Fast and controlled; three more reps. |
| 6 | 4 or more | Warm-up or technique work. |
The scale was set out for lifting by Zourdos and colleagues in 2016, and it’s now standard in RPE-based programs.
How the calculator works
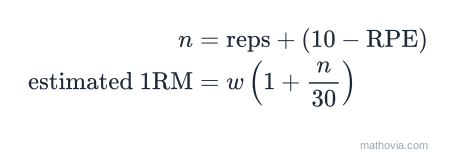
Step 1 — effective reps. Add the reps you had left to the reps you did:
Step 2 — share of your max. A set taken to failure with that many reps is a known fraction of your one-rep max. The calculator uses the Epley formula, the same one behind the strength level calculator:
A true single at RPE 10 is counted as 100%, and between one and two effective reps the value is interpolated.
Step 3 — divide and multiply. Your estimated max is the weight divided by that share, and the weight for any other set is the max multiplied by the share for those reps and that RPE.
Worked example: 100 kg × 5 at RPE 8, then 3 at RPE 9
These are the calculator’s default values.
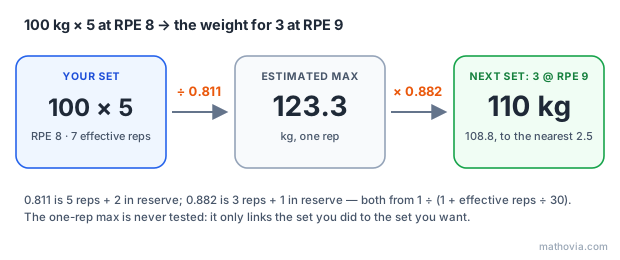
Step 1 — the set you did. Five reps with two in reserve is 7 effective reps:
Step 2 — estimated max.
Step 3 — the next set. Three reps at RPE 9 is 3 + 1 = 4 effective reps, or 88.2% of max:
Rounded to the nearest 2.5 kg that’s 110 kg. If you’d rather err on the light side, 107.5 kg is also fine; the difference is less than half an RPE point, well within the precision of anyone’s rating.
A second example: a back-off set in pounds
You squat 315 lb for 3 reps at RPE 9. That’s 4 effective reps, 88.2% of max, so your estimated max is
RPE chart
Each cell is the percentage of one-rep max for that many reps at that RPE.
| RPE | 1 | 2 | 3 | 4 | 5 | 6 | 7 | 8 | 9 | 10 |
|---|---|---|---|---|---|---|---|---|---|---|
| 10 | 100.0 | 93.8 | 90.9 | 88.2 | 85.7 | 83.3 | 81.1 | 78.9 | 76.9 | 75.0 |
| 9.5 | 96.9 | 92.3 | 89.6 | 87.0 | 84.5 | 82.2 | 80.0 | 77.9 | 75.9 | 74.1 |
| 9 | 93.8 | 90.9 | 88.2 | 85.7 | 83.3 | 81.1 | 78.9 | 76.9 | 75.0 | 73.2 |
| 8.5 | 92.3 | 89.6 | 87.0 | 84.5 | 82.2 | 80.0 | 77.9 | 75.9 | 74.1 | 72.3 |
| 8 | 90.9 | 88.2 | 85.7 | 83.3 | 81.1 | 78.9 | 76.9 | 75.0 | 73.2 | 71.4 |
| 7.5 | 89.6 | 87.0 | 84.5 | 82.2 | 80.0 | 77.9 | 75.9 | 74.1 | 72.3 | 70.6 |
| 7 | 88.2 | 85.7 | 83.3 | 81.1 | 78.9 | 76.9 | 75.0 | 73.2 | 71.4 | 69.8 |
| 6.5 | 87.0 | 84.5 | 82.2 | 80.0 | 77.9 | 75.9 | 74.1 | 72.3 | 70.6 | 69.0 |
| 6 | 85.7 | 83.3 | 81.1 | 78.9 | 76.9 | 75.0 | 73.2 | 71.4 | 69.8 | 68.2 |
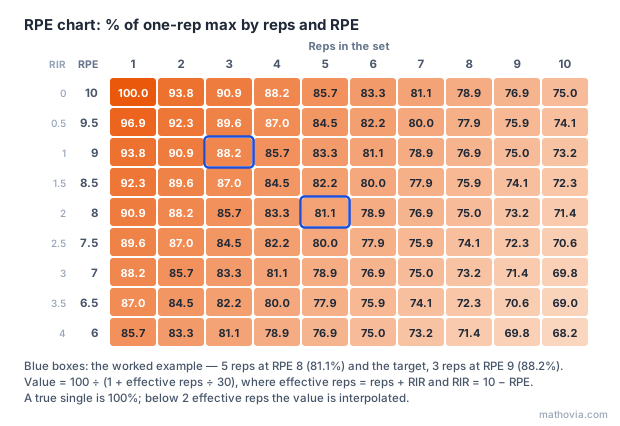
Notice the diagonals. Moving one column right and two rows up (one full RPE point) gives the same number, because one more rep done and one fewer rep in reserve add up to the same effort. Five at RPE 8 and seven at RPE 10 are both 81.1%.
Using RPE in a training session
- Top set, then back-offs. Work up to one set at the planned RPE, estimate your max from it, and use that to set the weight for the rest of the session.
- Track your estimated max. An e1RM that rises week to week at the same RPE is progress, without ever testing a true max.
- Let the day decide. Poor sleep or a stressful week shows up as a lower estimate, and the loads follow it down automatically.
Common mistakes
- Rating easy sets. Estimates from RPE 6 or 7 are much less reliable than from sets at RPE 8 to 10.
- Counting grinders as clean reps. RPE assumes the reps you had left would have been good reps.
- Using high-rep sets. Past about 10 reps, formulas like Epley lose accuracy.
- Chasing a precise number. The rating is a judgement. Treat the output as a starting point and adjust from the bar speed of the first set.
Sources and assumptions
This calculator assumes:
- RPE is based on reps in reserve: RPE 10 means no reps left, RPE 9 means one.
- The percentage-of-max chart is an average; individual lifters vary.
Sources:
- Zourdos, M. C. et al., Novel resistance training-specific rating of perceived exertion scale measuring repetitions in reserve, J Strength Cond Res 30(1):267–275 (2016)
Figures last reviewed: . Educational estimates, not professional advice.