An equation like
The graph is the picture of the solution set. Every point on it is a solution; every solution is on it. That is the whole meaning, and once it clicks, graphing stops being a mechanical chore and starts being a way of seeing an equation.

The Core Method
Choose
Step by Step: The Table of Values
This method works for any equation, which is why it is worth doing carefully a few times before you rely on shortcuts.
1. Solve for
2. Choose
3. Compute each
4. Write the pairs. Line them up in a table so mistakes are easy to spot.
5. Plot and join. Plot every pair, then draw the line or curve. If a plotted point sits well off the pattern of the others, recheck its arithmetic before you draw.
Example:
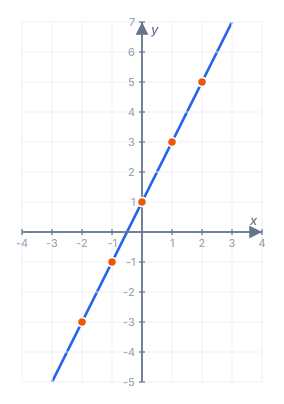
Plot the five points. They fall in a straight line, so draw the line through them and extend it past the outer points with arrows on both ends — the graph continues forever in both directions.
How Many Points You Actually Need
- A straight line is fixed by two points. Compute two, draw the line, and add a third as a check — if it does not land on the line, one of the three has an arithmetic error.
- A parabola or other curve needs more — five to seven points, spread on both sides of the turning point, so the bend is visible. Two points on a curve tell you almost nothing.
The fastest two points for a line are usually the intercepts: set
Choosing
Integers near zero work most of the time. Adjust when the equation fights back:
- Fractions. For
, choose — multiples of keep whole and easy to plot. - Curves. For
, spread out: . The symmetry about is a built-in check — and should match. - Square roots. For
, only is allowed, and perfect squares give whole -values.
Recognising the Shape Before You Plot
You can often predict the shape from the equation:
| Equation looks like | Graph is |
|---|---|
| a straight line | |
| an | a parabola |
| a hyperbola (two branches) | |
| half a sideways parabola | |
| a V or a corner |
If you expect a line and your points curve, you have a mistake. If you expect a parabola and get three collinear points, you have not plotted enough of them.
Worked Example A: A Line From Standard Form
Graph
Solve for
Three points, all in line. Draw it. Notice
Worked Example B: A Parabola
Graph
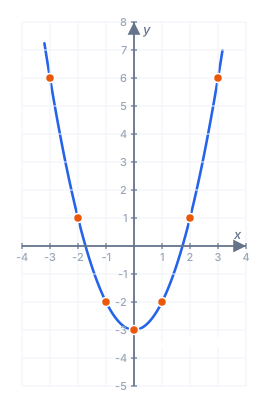
The table is symmetric about
Worked Example C: When to Pick Non-Integer
Graph
Integers would give quarters. Use multiples of
Every
Worked Example D: Verifying a Point Is on the Graph
Is
Substitute:
Common Mistakes to Avoid
- Plotting only two points for a curve. Two points always look like they belong to a line. Curves need enough points to show the bend.
- Joining points with straight segments when the graph should curve. A parabola is one smooth arc, not a dot-to-dot.
- Forgetting to extend a line. A line goes forever; draw arrows past your outer points unless the problem restricts the domain.
- Choosing
-values that make messy. If the equation has a denominator, pick -values that clear it. - Not checking symmetry on a parabola.
and should be equal; if they are not, recheck. - Skipping the third point on a line. The check point costs almost nothing and catches sign errors.
- Reading the axes without their scale. If each square is
units, a point “3 squares up” is at .
Where Graphing Equations Shows Up Next
- Lines. Slope-intercept and point-slope forms let you graph a line without a full table.
- Slope. The steepness you see in a graph is the slope, computed from any two of its points.
- Solving systems. Two graphs drawn together cross at the solution of the system.
- Functions. A function’s graph is built the same way, with
replaced by . - Quadratics and beyond. Vertex, intercepts, and symmetry turn the table method into a quick sketch.
Practice Problems
Work each one before opening the answer.
Problem 1. Build a table for
Show answer
Problem 2. Build a table for
Show answer
Problem 3. Which two points would you compute to graph
Show answer
The intercepts:
Problem 4. For
Show answer
Multiples of
Problem 5. Is
Show answer
Problem 6. Is
Show answer
Problem 7. Build a table for
Show answer
Problem 8. Without plotting, is the graph of
Show answer
A line —
Problem 9. Without plotting, is the graph of
Show answer
A curve — the
Problem 10. A student plots
Show answer
Problem 11. For
Show answer
Use perfect squares:
Problem 12. The graph of an equation passes through
Show answer
From
Quick Reference
| Step | What to do |
|---|---|
| 1 | Solve for |
| 2 | Choose |
| 3 | Compute each |
| 4 | Write ordered pairs in a table |
| 5 | Plot the pairs |
| 6 | Join: straight line, or smooth curve |
| Line | 2 points + 1 check; intercepts are fastest |
| Parabola | 5–7 points, symmetric about the vertex |
The pairs in the table are tested the way Ordered Pairs describes, the two fastest points are the x- and y-intercepts, and Lines shows how to skip the table for linear equations. More Algebra lessons are available too.