A polynomial inequality compares a polynomial to zero:
The method that does work is the sign chart (also called a sign diagram or the test-point method). A polynomial can only switch between positive and negative at a point where it equals zero. Find those points, split the number line at them, and test one value in each piece.
The Polynomial Inequality Formula
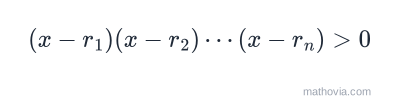
The
The Sign-Chart Method
- Move every term to one side so the other side is
. - Factor the polynomial completely.
- Find the critical values — set each factor to zero.
- Draw a number line, mark the critical values, and split it into intervals.
- Test one point in each interval in the factored form; record
or . - Select the intervals whose sign matches the inequality. For
or , also include the critical values. - Write the answer in interval notation.
Worked Example A: A Quadratic Inequality
Solve
Step 1–2 — one side is already zero; factor:
Step 3 — critical values:
Step 4–5 — test the three intervals:
| Interval | Test point | Sign | |
|---|---|---|---|
Step 6–7 — we want
Answer:
Worked Example B: A Non-Strict Inequality
Solve
Factor:
| Interval | Test point | Sign |
|---|---|---|
We want
Answer:
Worked Example C: A Cubic
Solve
Factor:
| Interval | Test point | Sign | |
|---|---|---|---|
We want
Answer:
Worked Example D: A Repeated Factor
Solve
Critical values
| Interval | Test point | Sign | |
|---|---|---|---|
The sign does not flip at
Answer:
Why a Polynomial Only Changes Sign at a Root
A polynomial is a continuous, unbroken curve — it never jumps. To get from positive to negative, its graph has to pass through zero, and the only
Multiplicity: When the Sign Does Not Flip
At a root that comes from a factor raised to an odd power (multiplicity 1, 3, …), the polynomial does change sign — the graph crosses the axis. At a root from a factor raised to an even power (multiplicity 2, 4, …), the polynomial touches the axis and turns back, so the sign is the same on both sides.
For a non-strict inequality, an even-multiplicity root still gets included in the solution (it makes the product zero, which satisfies
Worked Example E: A Quadratic That Does Not Factor
Solve
Step 1 — one side is zero; the quadratic does not factor over the integers, so find its roots with the formula:
Numerically,
Step 2 — test the three intervals (any convenient point):
| Interval | Test point | Sign | |
|---|---|---|---|
Step 3 — we want
Answer:
Common Mistakes to Avoid
- Dividing by a variable factor.
is not ; dividing by loses and ignores that can be negative. Move everything to one side and factor: . - Not setting one side to zero first. The sign chart tracks the sign of a single expression versus zero.
- Forgetting the endpoints for
/ . Non-strict inequalities include every critical value. - Including endpoints for
/ . Strict inequalities exclude them. - Assuming the sign always alternates. It alternates only at simple (odd-multiplicity) roots. At a squared factor it does not flip.
- Picking a test point on a critical value. Test points must be strictly inside an interval.
Where This Shows Up Later
- Rational Inequalities. Same sign-chart method, with the extra step of marking where the denominator is zero as an always-excluded critical value.
- Graphing polynomials. The sign chart is a shortcut for sketching where the graph is above or below the
-axis, and multiplicity explains “cross versus touch” at each intercept. - Quadratic applications with a constraint. “For what dimensions is the area at least 40?” is a polynomial inequality.
- Calculus. Finding where a derivative is positive or negative (to locate increasing/decreasing intervals) is exactly this method.
Practice Problems
Work each problem yourself before opening the answer. Give solutions in interval notation.
Problem 1. Solve
Show answer
Answer:
Problem 2. Solve
Show answer
Answer:
Problem 3. Solve
Show answer
Answer:
Problem 4. Solve
Show answer
Answer:
Problem 5. Solve
Show answer
Answer:
Problem 6. Solve
Show answer
Answer:
Problem 7. Solve
Show answer
Answer:
Problem 8. Solve
Show answer
Critical values
We want
Answer:
Problem 9. Solve
Show answer
Answer:
Problem 10. Solve
Show answer
Answer:
Problem 11. Solve
Show answer
Answer:
Problem 12. Solve
Show answer
Critical values
We want
Answer:
Problem 13. Solve
Show answer
Roots from the formula:
Answer:
Problem 14. Solve
Show answer
Critical values
We want strictly
Answer:
Quick Reference
| Step | Detail |
|---|---|
| 1 | Move all terms to one side; other side |
| 2 | Factor completely |
| 3 | Critical values = roots (each factor |
| 4 | Split the number line at the critical values |
| 5 | Test one point per interval in the factored form |
| 6 | Keep intervals whose sign matches; add endpoints for |
| Repeated (even) factor | sign does not change there |
| Simple (odd) factor | sign changes there |
Factoring uses Factoring Quadratics; the answer format is Interval Notation. The next step, with denominators, is Rational Inequalities. More Algebra lessons are available too.